Mana Administrator's Guide
- Site Administration
- Events and Notifications
- Issue Creation Diagnostic Tools
- System-specific Issue Generation Settings
- How to configure (and validate) new customers and sites?
- Site Status Questions
- Data "Aggregation" Algorithms
- Initial Data
- Company Logos
Site Administration
Explanation of settings and processes available to administrators only
Events and Notifications
Quick Reference
How can I just stop the system from automatically generating issues? I still want other notifications - for example, when someone adds a comment to an issue - to be sent out.
Open the notifications control panel and make sure the service state is set to "On", and un-check the "Automatic issue generation enabled" option.
How can I just stop the system from automatically generating issues for certain devices only? I still want other notifications to be sent out and issues generated for all other device manufacturers.
Open the notifications control panel and make sure the service state is set to "On" and the "Automatic issue generation enabled" option is checked, and select the manufacturer(s) you don't want issues generated for in the "Disable issue generation for these types of devices" drop-down.
How can I stop notifications from being sent out, including any notifications that were delivered to me but not yet to the user? I may want users to receive emails about some of the events that occur while notifications are off after I turn notifications back on.
Set the notifications service state to Suspended, and on the Pending Emails tab use the Cancel button to stop any pending emails from being delivered.
How can I stop issues being generated and notifications from being sent out if I don't care about events that occur while notifications are off?
Set the notifications service state to Off, and on the Pending Emails tab use the Cancel button to stop any pending emails from being delivered. No emails will be generated for any events that occur in the future.
How can have the system only send emails about future events to me?
Set the notifications service state to Test or Debug, and on the Pending Emails tab use the Cancel button to stop any pending emails from being delivered. If you set it to Test mode, the system will only send emails info@manamonitoring.com. If you set it to Debug mode, the system will only email developers about any events that occur while notifications are off.
How can I turn notifications back on if the notifications service state is Suspended?
First check for any events that have not yet been processed on the Suspended Events page and use the Cancel or Cancel All functions to stop them from being queued for delivery. Then set the notifications service state to On.
How can I turn notifications back on if the notifications service state is Off?
Simple, just set the notifications service state to On.
Overview
To understand how notifications work, let's consider the sequence of events that need to occur for someone to be notified when a comment is added to one of their issues:
- Someone adds a comment to an issue
- The system stores the comment and records the occurrence of a comment-added event
- The front-end notifications service regularly checks if there are any events that have not yet been processed, finds our new comment-added event, generates and sends email user notifications for every user that is affiliated with the issue, and marks the event as processed
In this discussion we will be using the term "event" to denote something that occurred that people should be notified about, and "user notification" to mean an actual email sent to, or notification shown to a specific user on the website. An event is tied to the issue/system/site that it relates to. A user notification is tied to an event and to the user that it is meant for.
In the database, what is described above as an event is called a "notification", and what is described above as a "user notification" is called a "notification of user."
The issue-added event may have any number of user notifications generated for it. A notification currently can be shown to the user through two channels: email or the notifications widget on the site dashboard.
The Notifications Control Panel
Setting the Notifications Service State
In the Notifications Control Panel we can set the state of the notifications service as follows:

On means that the notifications service is running normally and creating emails from unprocessed events that occurred in the system. If a Client Delivery Delay is set, then these emails are first sent to info@manamonitoring.com and, after the delay has elapsed, sent to the actual user. If no Client Delivery Delay is set or it is set to 0, then email are sent directly to the user without without a delay.
Suspended means that the notifications service is temporarily not processing events. This does not mean that events aren't generated, it only means that no user notifications are created for the event.
Test mode means that user notifications are being generated, but they are marked as "test" notifications and only delivered to info@manamonitoring.com
Debug mode means that user notifications are being generated, but they are marked as "debug" notifications and only delivered to developers.
Off means that no issues are created for system COM_ERR or NOT_PRODUCING errors, and any other event that occurs is discarded; specifically, it is recorded as a deleted event. No user notifications are generated for deleted events.
Refer to the following table to understand what will happen when you change the service state:
| Previous state | New state | What will happen? |
| Test or debug mode | On |
Users will be notified of future events (that occur after you turn notifications on).
Explanation: User notification emails have been generated continuously and marked as "test" or "debug" and delivered to info@manamonitoring.com (or to the developer). These emails will not be resent to the user.
Use the |
| Suspended | On |
Notification emails will be generated for every events that occurred since the notification service state was suspended.
Explanation: although the notifications service was suspended, events were still being recorded by the system. After turning the service on, the system will see that these events have not had notification emails created for them and will create these emails.
Use the |
| On | Suspended |
Any email notifications shown on the Pending Emails tab will be delivered to the users after the timeout elapses. Use the Further processing of events will be suspended. |
| Test or debug mode | Suspended |
Processing of events will be suspended. Since test or debug type user notifications were being generated, and these are never automatically sent to the user, there should be no danger of any notifications being sent to users after the service is suspended. |
| On | Test or debug mode |
Pending notifications of past events will still be delivered to users, but emails will only be sent to info@manamonitoring.com (or to the developers) of any future events. Use the |
| Suspended | Test or debug mode |
Notification emails will be generated for every event that occurred since the notification service state was suspended, but they will only be send to info@manamonitoring.com (or to the developers).
Explanation: although the notifications service was suspended, events were still being recorded by the system. After turning the service on, the system will see that these events have not had notification emails created for them and will create these test/debug type user notifications. |
| On | Off |
Pending notifications of past events will still be delivered to users, but future events will not generate any notifications even after notifications are turned back on. |
| Suspended | Off |
Events that occurred while the notifications service was suspended will be processed once the service is turned back on. Future events that occur while notifications are off will not generate any notifications, even after notifications are turned back on. |
| Test or Debug mode | Off |
Future events will not generate any notifications even after notifications are turned back on. Since test or debug type user notifications were being generated, and these are never automatically sent to the user, there should be no danger of any notifications being sent to users after the service is suspended. |
| Off | On / Test or Debug mode |
Future notifications will be sent to the user or to Mana depending on the mode chosen. Past events have been discarded and no notification will be generated for them. Note that there may be unprocessed events that will have notifications generated for them if the notifications service state was set to suspended before it was turned off. |
| Off | Suspended |
Future notification events will be recorded and sent out once notifications are turned back on. Past events have been discarded and no notification will be generated for them. |
Setting the User Notification Delay
When notifications are on, the system first sends each user notification to info@manamonitoring.com and then, after waiting out a delay, sends the notification to the user (provided it hasn't been cancelled in the meantime). This delay can be set in the Notifications Control Panel:

To configure the system to send notifications to the client without first sending a copy of the pending email to info@manamonitoring.com, and without waiting for a delay to elapse, then set the notifications service state to "On" and set the Client Delivery Delay to 0.
Turning Issue Generation Off
The system is able to automatically generate issues when a system is not producing or not communicating. This issue generation can be turned on or off independently of the state of the notifications service in the notifications control panel:

When notifications are on, but issue generation is off, the website shows the notifications state as "ON!" in orange:

Turning Issue Generation Off for Certain Manufacturer(s)
Issue generation can also be turned off for certain device manufacturer(s). To do so, select the manufacturer(s) from the "Disable issue generation for these types of devices" drop-down:

The website shows the notifications state as "ON!" in orange to warn that this setting is in effect:
Server-side Notifications Kill Switch
There is a kill-switch mechanism to disable notifications in code that can be used by developers when working on the site to make sure that unwanted notifications aren't accidentally sent out. This kill-switch is useful, for example, when aggregation needs to be shut down for a while - we don't want the site to start sending out notifications that systems are down, when really they are not.
When this kill-switch is set, the notifications state shows "DISABLED":

...and the notifications control panel also reflects this:

When the kill switch is set, the following holds true:
- The notifications service state cannot be changed from the website, so all other options are disabled. A developer can set this state by setting \app\models\application\Notification::$sendemails to true or false.
-
Send to MeandSend to Devbuttons work - Debug and Test modes works as usual
- Dev and Test websites still send notifications only internally as usual
- When notifications are "On" but the kill-switch is set, the first email (with the subject
...[Delivery to ... in XX minutes], but the final email that would be sent to the client is actually only sent internally to us (with a subject... [Simulation / ...])
Deciphering Email Subjects
The subject of a generated email indicates what state the Notifications Service State is in, and if a follow-up email will be sent.
| Sample Subject | What this Means |
| Issue BPS 305 McKinley HS / RC E-702 Created for J... [Delivery to zoltan@manamonitoring.com in 60 minutes] | Notifications service state is "On" and a notification will be sent to the recipient named in the subject of the email after the delay indicated UNLESS the notifications service is disabled in code, in this case the final email will be sent internally only. |
| Facebook 2 COM ERR INV1/INV2/INV3/INV4/... Site Alert | This notification is the final notification sent to the client. |
| Otero Resolved P005-InvB Site Alert (PNM-1536) [Simulation / warren.hanson@affordable-solar.com] | The notifications service state is "On" but notifications have been disabled in code (see "Notifications Kill-Switch" above). The email will never be sent to the intended recipient. Contact a developer to disable the kill-switch. |
| Wilson ES COM ERR Building A Site Alert (RC E-695) [YII_ENV_DEV / jeff@hawaiipacificsolar.com] | This is a notification generated by dev.manamonitoring.com, it isn't actually delivered to the client. |
| Stevenson IS Resolved Building A Site Alert (RC E-... [YII_ENV_TEST / jeff@hawaiipacificsolar.com] | This is a notification generated by test.manamonitoring.com, it isn't actually delivered to the client. |
| Radford Resolved Building M Site Alert (RC E-459) [DEBUG mode / zoltan@manamonitoring.com] | Notifications service state is in "Debug" mode and will only be delivered to developers. |
| Kamaile COM ERR Building D & F Site Alert (RC E-56... [TEST mode / jeff@hawaiipacificsolar.com] |
Notifications service state is in "Debug" mode and will only be delivered to info@manamonitoring.com |
Managing Events and Notifications
Reviewing Notifications
Administrators can view events and notifications in the site:

Pending Emails shows user email notifications that have been generated and already sent to info@manamonitoring.com but not yet delivered to the actual user. Use this tab to review notifications that will be sent out to users soon. This tab should only contain notifications when the notifications service state is set to "On" or was "On" not long ago.

Delivered Emails shows all the last 50 user notifications (emails), whether they were delivered to the actual user or sent only to info@manamonitoring.com or to developers. Use this tab to mark test/debug emails for delivery to the user, or to resend an email to the recipient or to yourself.

Suspended Events shows events that have not yet been processed. When the notifications mode is set to "On", "Test", or "Debug", this tab should only show a few events that occurred in the last few minutes, i.e. since when the last time the notification generation service was run (it runs every few minutes). When the notifications service is suspended, you will see here all events that occurred after the service was suspended. Use the Cancel All or the individual Cancel buttons to cancel these events from being processed before turning the notifications state back on.

Canceled Events shows all events that were "canceled". Canceled events are never processed, thus no user notifications are generated from them. An event may be canceled by an administrator using the Cancel All or the individual Cancel buttons, or automatically by the system (for example, if an issue is deleted, any relevant notifications or, for example, a comment being added, are canceled). Use the Restore buttons to restore any canceled events, thus marking them for normal processing.
User Notification State
The state of the notifications service at the time when a user notification was created determines the type of notification created. The notification type can be seen on the Delivered Emails page, on the top-right corner:

A user notification can be one of the following types:
On: the notification is delivered to info@manamonitoring.com, and after a timeout, delivered to the user.
Test: the notification is only delivered to info@manamonitoring.com
Dev: the notification is only delivered to the developer(s).
Available Functions for User Notifications
Cancel Delivery: avalable on "On" type notifications that have not yet been delivered to a user, use this to change the notification type to "Test", thus canceling the final delivery of this notification.
Mark for Delivery: available on "Test" type notifications that have not yet been delivered to a user, use this to change the notification type to "On" thus marking it for delivery to the user.
Send to Me/Dev: use this button to immediately send a copy of this notification to yourself or to the developer.
Mark as Delivered: available only on notifications that have not yet been sent to the user, use this button to indicate that the notification has been delivered to the user (i.e. the test email was manually forwarded). The "Sent" date/time of the notification will be set to now.
Resend to Recipient: use this to clear the "sent" date of a notification, thus queuing it to be reprocessed and thus resent to the user.
Available Functions for Events
Cancel / Cancel All: use these buttons to cancel/delete an event. Canceled events are never processed, thus no notification will be generated from the event.
Restore: use this to restore a canceled event. The next time the notifications engine will run, user notifications will be generated for this event.
Types of Notifications
| Code | Name | Description |
| IssueCreatedForMe | Issue Created for Me | When a new issue is created, the system sends a notification to the assignee. |
| IssueAssignedToMe | Issue Assigned to Me | When an existing issue is assigned, the system sends a notification to the new user. |
| IssueStatusChanged | Issue Status Changed | When an issue status is changed, the system sends notifications to the issue creator and assignee. |
| IssueDeleted | Issue Deleted | When an existing issue is deleted, the system sends notifications to the issue creator and assignee. |
| IssueCommentAdded | Issue Comment Added | When a comment is added to an issue, the system sends notifications to the issue creator and assignee. |
| SystemStatusComErr | System COM ERR | When system production status changes from normal to COM ERR, the system sends notifications to everyone associated with the system. |
| SystemStatusNotProducing | System NOT PRODUCING | When system production status changes from normal to NOT PRODUCING other status, the system sends notifications to everyone associated with the system. |
| SystemStatusComErrResolved | System COM ERR Resolved | When system production status changes from COM ERR to a normal status, the system sends notifications to everyone associated with the system. |
| SystemStatusNotProducingResolved | System NOT PRODUCING Resolved | When system production status changes from NOT PRODUCING to a normal status, the system sends notifications to everyone associated with the system. |
| SystemConsumptionStatusComErr | System Consumption COM ERR | When system consumption status changes from normal to COM ERR, the system sends notifications to everyone associated with the system. |
| SystemConsumptionStatusComErrResolved | System Consumption COM ERR Resolved | When system consumption status changes from COM ERR to a normal status, the system sends notifications to everyone associated with the system. |
| SystemProductionDeviation | System Production DEVIATION | Users are notified when system production significantly deviates from the expected value. |
| SystemProductionDeviationResolved | System Production DEVIATION Resolved | Users are notified when a system whose output significantly deviated from expected once again generates values that fall within the range of expected values. |
See Mana_MetaData RXX.xlsx
Configuring Notifications
Subscribing to Notification Types
A user can opt to receive various types of notifications generated by the system through the website and/or via email. This needs to be set for the user on the Users worksheet in Initial Data. The possible settings are:
- "ALL": user receives all notifications of the given type (for all sites/issues that he has access to, regardless whether he or she is "subscribed" to the issue or not)
- "Created/Assigned/Watching": user only received notifications for issues that he created, that he is assigned to, or that he subscribed to
- "NONE" or blank: user received no notifications for the given notification type.
Consider the following example for user "John":

This user will:
- Receive "System Status Needs Attention" emails for every system that he/she has access to
- Receive no emails for "System Production Deviance" type alerts
- Receive emails whenever an issue is created for anyone, for every system that he/she has access to
- Receive emails whenever an issue is created for anyone, for every system that he/she has access to
- Receive emails whenever an issue status changes only for those issues that he/she created, is assigned to, or is wacthing
- Receive emails whenever an issue is deleted, for every system that he/she has access to
- Receive emails whenever a comment is added to an issue that he created, is assigned to, or is "watching"
Additionally, the user will be set to automatically start watching any issue that he edits / adds a comment to.
Who gets what?
The following events/actions trigger notifications (see MANA-2919 for a history of how these were determined).
Note that a user who is subscribed to "ALL" notifications of a given type will receive all such notifications regardless of whether he/she is the assignee/creator/is or is not watching the issue. Similarly, a user who is set to receive "NONE" of the notifications of a given type will never receive that type of notification, even if he is the assignee/creator/set to watch the given site. See Subscribing to Notification Types above.
1. Issue Created for Me Email
Any user who is subscribed to "ALL" "Issue Created for Me Email" notifications (and has access to the given site) will be notified of this event.
Additionally the following users will be notified of this event, provided they are set to receive "Created/Assigned/Watching" "Issue Created for Me Email" notifications (see Subscribing to Notification Types above):
- the issue assignee
- the issue creator
- Anyone who opts to "watch" the issue
2. Issue Assigned to Me Email
Any user who is subscribed to "ALL" "Issue Assigned to Me Email" notifications (and has access to the given site) will be notified of this event.
Additionally the following users will be notified of this event, provided they are set to receive "Created/Assigned/Watching" "Issue Assigned to Me Email" notifications (see Subscribing to Notification Types above):
- issue assignee
- Issue creator
- Anyone who opts to "watch" the issue
3. Issue Status Changed Email
Any user who is subscribed to "ALL" "Issue Status Changed Email" notifications (and has access to the given site) will be notified of this event.
Additionally the following users will be notified of this event, provided they are set to receive "Created/Assigned/Watching" "Issue Status Changed Email" notifications (see Subscribing to Notification Types above):
- issue assignee
- Issue creator
- Anyone who opts to "watch" the issue
4. Issue Deleted Email
Any user who is subscribed to "ALL" "Issue Deleted Email" notifications (and has access to the given site) will be notified of this event.
Additionally the following users will be notified of this event, provided they are set to receive "Created/Assigned/Watching" "Issue Deleted Email" notifications (see Subscribing to Notification Types above):
- issue assignee
- Issue creator
- Anyone who opts to "watch" the issue
5. Issue Comment Added Email
Any user who is subscribed to "ALL" "Issue Comment Added Email" notifications (and has access to the given site) will be notified of this event.
Additionally the following users will be notified of this event, provided they are set to receive "Created/Assigned/Watching" "Issue Comment Added Email" notifications (see Subscribing to Notification Types above):
- issue assignee
- Issue creator
- Anyone who opts to "watch" the issue
6. System Status Needs Attention Email
Any user who is subscribed to "ALL" "System Status Needs Attention Email" notifications (and has access to the given site) will be notified of this event.
Additionally the following users will be notified of this event, provided they are set to receive "Created/Assigned/Watching" "System Status Needs Attention Email" notifications (see Subscribing to Notification Types above):
- "Primary User" of "System Owner" company of the site
7. System Production Deviance Email
Any user who is subscribed to "ALL" "System Production Deviance Email" notifications (and has access to the given site) will be notified of this event.
Additionally the following users will be notified of this event, provided they are set to receive "Created/Assigned/Watching" "System Production Deviance Email" notifications (see Subscribing to Notification Types above):
- "Primary User" of "System Owner" company of the site
Watching an Issue
A user can manually start to watch an issue by clicking the "Start watching this issue" link on the issue for which he wishes to receive notifications:
Note: as specified in "Who gets what?" above, some users receive notifications about an issue regardless whether they are watching it or not. For example, the issue assignee always gets an email about an "Issue Created for Me" event unless this event is turned off for him in initial data.
Autowatch
The "Autowatch" feature was implemented in MANA-2919 / MANA-3538 and works as follows: a user who has "Autowatch" activated will automatically start watching an issue if he adds a comment or edits the issue etc.
This setting can be set in Initial Data, on the "Users" table, by setting the "Automatically start watching issues I interact with?" column to "X":

Configuring the Default Email Subject and Body
This can be set in the Notifications worksheet of the current Mana_MetaData RXX.xlsx workbook.
Configuring Custom Email Subject and Body for a Client
This can be done on the Notifications by Client worksheet of the current Mana_MetaData RXX.xlsx workbook.
Technical Reference
In this discussion we will be using the term "notification" to denote something that occurred that people should be notified about, and "notification of user" to mean an actual email sent to, or notification shown to a specific user on the website.
What types of notifications are recorded by the system?
- When an issue is created (either automatically or by a user), a SystemStatusComErr, SystemStatusNotProducing, or an IssueCreatedForMe type notification is recorded. See sp_entity_insert_issue
- When a user changes the status of a notification using the Confirm/Close/Reopen buttons, a IssueStatusChanged type notification is recorded. See sp_issue_action
- When a user assigns an issue to someone, an IssueAssignedToMe type notification is recorded. See sp_issue_assign
- When a user comments on an issue, or when a user edits an existing comment, an IssueCommentAdded type notification is recorded. See sp_issue_comment_add and sp_issue_comment_update
- When an issue is automatically closed, for example, when a NOT PRODUCING issue is closed because the system determines that communications have been restored, a SystemStatusComErrResolved, SystemStatusNotProducingResolved, or IssueStatusChanged type notification is recorded. See sp_autoclose_issues
- When an issue is deleted, the user give a reason. This reason is attached to the issue as a comment, and an IssueDeleted type notification is recorded. See sp_entity_delete_issue
Issue Creation Diagnostic Tools
Overview
Before an issue is generated, we perform some extra checks. This is so because previously we created issues when we should not have, so we added these checks. Some of these checks are obvious, for example we don't create an issue if one already exists, or if we've never received any data for the system (perhaps because it hasn't been set up properly yet). Some other checks are not so obvious. For example, if a system status is not producing, but new readings are being loaded that indicate that the system is coming back online, then we hold off with issue creation. Also, if readings indicate that data is being bulk-imported (we know this if many readouts are being loaded with the same readout timestamp), then we wait for this to finish before creating an issue. See Review the event log section below for an explanation of how these extra checks are performed.
Another aspect of issue creation is determining how long since the problem started. There are two approaches:
- "straightforward" approach: consider how much time has elapsed since the system status changed to COM ERR or NOT PRODUCING
- "smart" approac: find the last significant readout for the system and consider how much time has elapsed since then
The last "significant readout" is identified based on the system status. If the system is in COM ERR then we haven't been receiving readouts at all, so the last significant readout is the last non-zero readout that we received. If that was 4 hours ago then the issue has been around for 4 hours. If the system is in NOT PRODUCING state then we consider the newest readout, and walk backwards in time until we find a readout that is significantly different. Here we use the same algorithm used in site status determination, so if an explicit Minimum Production Threshold is set for the system, we use that, otherwise we calculate using the system DC size (or AC if DC is unavailable), or fall back on a fixed threshold of 5 kWh. So basically if the latest reading is 12345 kWh, and a fixed threshold of 5 kWh is set, then we backtrack until we find a reading less than 12340 kWh, and consider the outage to have started then.
Each of the two approaches to determine how long since the problem started has its merits and drawbacks. If we simply use the time then the system status changed, then we cannot run extra checks for example to see if the system is showing signs of life. However this way notifications are more consistent with system status, so clients don't question why an issue wasn't created even though the system has been in not producing state for a while. If we use the second "smart" method and determine when the last significant readout was acquired, then we can be more accurate in only creating issues if the system really requires attention, lowering false-flag notifications. For example, this way if we set up a new system and it takes Mana several days to acquire all historical readings for the system, then initially the system status will start to show that the system is Not Producing, but as long as we enable the extra checks, no issue will be created or notification sent out. Similarly, if a system stops communicating and goes into COM ERR, but then comes back online but initally reports very small readings, then the extra checks can help us to avoid unnecessarily creating a NOT PRODUCING issue.
Determining the time when the issue started is also important because this is important information for the client. So, when checking an issue, it is more important to understand when the last good readout was acquired than to know at what point in time Mana determined that the system status should be Not Producing or Com Err. With systems that have a large COM ERR timeout, a system can stop reporting hours or even days before the system status changes. An issue is then created but in the issue we want to see not the point in time when the system status changed, but the point in time when the system actually stopped reporting.
For some clients (currently NPC) we skip all extra checks and just consider how much time has elapsed since the system status deteriorated. For others we use the second "smart" approach
A site is down, yet no issue was created. Why?
If you suspect that an issue should have been created but wasn't, use the notification generation tool in simulation mode to see why the system isn't generating a notification:
- Log into the site as an administrator
- Open the site in question and navigate to the
Notificationstab - Click on the
Diagnosticsbutton - Make sure
Simulate Onlyis checked and clickGenerate Issues & Notifications

If it is nighttime at the site, the system will not generate an issue. Enable the Bypass Daytime Check option if you want to see if there is any other reason why the website hasn't generated an issue for the system.
If a user has already created an issue for the system, then the system will not automatically generate another one. Enable the Bypass Issue Exists Check option if you want to see if there is any other reason why the system hasn't generated an issue for the system.
If you do not wish to actually create an issue, make sure the Simulate Only option is checked.
The results of the issue generation are displayed with an explanation as to why an issue was or wasn't created:

Review the event log
Use the Event Log button to review issue generation events related to the system selected:


Note that the website does not record events if notifications are off for the given system. The following types of events are recorded:
-
Skipping: Irradiance low
No issue is created if irradiance checks are enabled and the site irradiance is under the irradiance threshold (which can be set independently for each site) -
Skipping: Not daytime
No issue is created if it is not "daytime" at the site; currently daytime is specified as "between 7 a.m. and 6 p.m." -
Skipping: Last report not found
If the system status is currently "COM ERR", then this means that the system has never reported any values; in such a case no issue is generated
If the system status if currently "NOT PRODUCING", then this means that the system has never reported any positive values; in such a case no issue is created -
Skipping: _daytimeMinutesDiff < _notifyAfterXMinutes
No issue is created until the specified timeout has elapsed. This timeout can be set for each system for COM ERR and NOT PRODUCING independently (see Setting the Issue Generation Timeout below). -
Skipping: Issue exists
No issue is generated if an open issue already exists for the given system. The following criteria are checked:- If the system status if NOT PRODUCING, and either a NOT PRODUCING or COM ERR type issue exists that was created by the system, no issue is generated
- If the system status if COM ERR, and a COM ERR type issue exists that was created by the system, no issue is generated
- If a user has created a COM ERR or NOT PRODUCING type issue after the system last report (i.e. after the problem started), then no issue is generated
-
Skipping: This is the first time we are identifying this problem
The system tries not to create an issue while readings are being loaded. This and the following two messages are related to this check. Specifically, if this is the first time we are identifying this problem (or the last time was a long time ago), we store the current reading in the `system` and skip, the next time around we will see if the reading is still the same...
-
Skipping: New readings have been loaded in the past 10 minutes
We have already checked this `system` over 10 minutes ago, but since then new readings have been loaded (for COM ERR), or new positive readings have been loaded (for NOT PRODUCING), so update the last reported time and check again 10 minutes from now... -
Skipping: Reload in progress...
We have already checked this system over 10 minutes ago, and no new readings have been loaded since, but a reload is in progress, so wait until at least 60 minutes have passed...
We know that a reload is in progress if more than one reading exists with the same sample time as the last reading (in case of COM ERR), or the last positive reading (in case of NOT PRODUCING). -
Skipping: Waiting at least 30 minutes before creating a NOT PRODUCING because the system was in COM ERR in the past hour...
We have already checked this system over 10 minutes ago, and no new readings have been loaded since, but the subsystem was in a COM ERR state in the past hour, so wait at least 30 minutes before creating a NOT PRODUCING issue. Basically, we try to give a system a bit of extra time to start reporting positive readings after it has come back from a COM ERR state before creating a NOT PRODUCING issue.
-
Creating Issue and Notification
All of the above exclusion conditions failed, therefore an issue is created for the system.
Error Log
Use the Error Log button to see if the system has encountered any errors during issue generation for the selected system.


"Cannot obtain lock on..." type errors may occur from time to time and are usually not a cause for concern.
Send Pending Emails
The website automatically checks every few minutes if there are any pending emails awaiting delivery. However, you can force the site to check immediately for any such messages and to then send them using the Send Pending Emails button:

System-specific Issue Generation Settings
System-specific Issue Generation Settings
Mana is able to automatically various types of issues and notifications automatically. For an overview, see: Notifications in the Mana User's Manual.
For a detailed overview of how COM ERR and NOT PRODUCING notifications work, see Events and Notifications in this guide. If you are an administrator looking to debug notifications, or find out why an issue was or was not created, see Issue Creation Diagnostic Tools.
System COM ERR Timeout
The website can be configured to wait a specified amount of minutes before setting a system's status to COM ERR. This is to allow some lag in communications between the device(s) and Mana. This timeout can be set on the system form:


Please see: System Statuses page in the Mana User's Manual.
System-specific Issue Generation Settings
Issue Generation Timeout
The website can be configured to wait a specified amount of daytime minutes after a system has stopped reporting before creating a COM ERR issue in the System-specific Notifications Control Panel. Similarly, a timeout can be set after a system has stopped reporting non-null values before a NOT PRODUCING issue should be created.
Note that the issue generation timeout is not in addition to the COM ERR timeout, but the COM ERR timeout must elapse before a system state is set to COM ERR. In other words, the system must first enter COM ERR (for this the timeout is set on the System properties page in the "Production COM ERR Timeout" field). Once it enters COM ERR, we check if the timeout set on the notifications panel for the system has elapsed, and if it has, the issue is created.
Enabling/Disabling Notifications for a System
Additionally, COM ERR, NOT PRODUCING, and production DEVIATION type notifications can be turned off completely for a system in the System-specific Notifications Control Panel.
Note that if you turn off a type of notification for a system, then such notifications will also be turned off for the subsystems of that system as well!
System-specific Notifications Control Panel
To set the above system-specific settings, click on the little envelope next to the given system:


COM ERR Notifications options
Uncheck the "Enabled" checkbox to completely disable COM ERR type notifications for this system and all of its subsystems.
Set a timeout threshold for how long a system should be in the COM ERR state before an issue is created, as explained above in Issue Generation Timeout section. If nothing is set, the default value is 120 minutes.
NOT PRODUCING Notifications options
Uncheck the "Enabled" checkbox to completely disable NOT PRODUCING type notifications for this system and all of its subsystems.
Set a timeout threshold for how long a system should be in the NOT PRODUCING state before an issue is created, as explained above in Issue Generation Timeout section. If nothing is set, the default value is 120 minutes.
Production DEVIATION Notifications options
See the Notifications chapter of the Mana User's Manual for an explanation of how Production DEVIATION notifications work.
Uncheck the "Enabled" checkbox to completely disable Production DEVIATION type notifications for this system and all of its subsystems.
Set a timeout threshold for how long readings need to deviate from the expected values before an issue is created.
Set the under- and over-performing threshold that needs to be exceeded before the above timeout becomes active. If the system is above or below the given threshold for at least the number of minutes set in the timeout, then an issue will be created.
How to configure (and validate) new customers and sites?
Having a new customer, the followings need to be registered in a separate, new „Initial Data” Excel

The brand new Excel to be used is in the "Attachment" section; Mana_InitialData_Template_R001.xlsx
Customer information to be added to „Clients” worksheet
Users to "Users" section
- Information to be gathered directly from the customer, or be searched in the internet, like „Time zone”
- Mandatory fields:
- Full Name, Email
- Password
- Status: Active / Inactive
- Time Zone
- Optional fields
- Phone
- Notification rights & configurations
-
Website notifications
E-mail notifications must be configured here. For details, please see „Subscribing to Notifications” and „Auto watch” paragraphs „Administrator’s Guide” / Events and notifications”: https://help.manamonitoring.com/books/mana-administrators-guide/page/events-and-notifications
-
Customer to „Companies” section
- Majority of the information is coming from the contract, the rest to be gathered from the internet, e.g. Widget.
- Mandatory fields
- ID: Must be a unique identifier
- Type: Finance / O&M
- Primary User: values coming from active users from „Users” section
- Optional fields
- Company Email, Company Phone, Company Website, Street Address, City, State, ZIP, Country, Weather Widget Label, Weather Widget Latitude, Weather Widget Longitude, Comments
- Rights & privileges
- Site features
- Reports; detailed in „SR – Standard reports” in „Mana Test Manual”
- Data streams: to be filled according to the devices / measurements relevant for the customer
- API: to be ticked only if customer is using our services only as a background API
Staff members to be added to „Staff” section
- Information to be gathered directly from the customer
- "Primary User" of a company does not need to be added as an employee
- Mandatory fields:
- Company: values are coming from „Companies” section
- User: values are coming from „Users” section
- Role: Administrator / Manager / Operator / Site owner
- Optional fields
- Unrestricted access? (Complete access to all sites of the customer)
- Tag-based access
-
-
- (Tags – i.e., grouped sites – to be added here comma separated)
-
-
Affiliates to be added to „Affiliates” section
- Information to be gathered directly from the customer
- Mandatory fields:
- Company: values are coming from „Companies” section
- Affiliate company: values are coming from „Companies” section
- Role: Full access / Restricted access
- Optional fields
- Unrestricted access? (Complete access to all sites of the customer)
- Tag-based access
-
-
- (Tags – i.e., grouped sites – to be added here comma separated)
-
-
Special Purpose Entities to be added to „SPE” worksheet
- Source: information is coming from Project Information Form (PIF) document
- Mandatory fields:
- ID: Must be unique, to be added manually
- Company name
- SPE Term (yrs)
- Optional fields
- Company Email, Company Phone, Company Website
- Street Address, City, State, ZIP, Country
Power Purchase Agreement (PPA) information to be added to „PPA Contracts” and „PPA Tables” worksheets
Contract information to „PPA Contracts” sheet
- Source: all the information is coming from Project Information Form (PIF) document
- Mandatory fields:
- Calculated Contract Label
- Site name
- PPA type: Export PPA / Host PPA
- Offtaker, Offtaker Short Name, Offtake Address, Offtaker City, Offtaker State, Offtaker Postal Code, Offtaker Country
- Special Purpose Entity (SPE); value list from „SPE” sheet
- PPA Start Date, Start Date on Invoice
- PPA Term (yrs), Base PPA Rate, Inflator, Inflator Type
- Tax rate
- Optional fields
- Contracting company: value list from „Clients” sheet
- Technical / administrative fields to be left blank
- Terminated
PPA rates and schedule to „PPA tables”
- Source: all the information is coming from Project Information Form (PIF) document
- Mandatory fields:
- PPA Contract:
- Initial term
- Term 2, … 4: to be calculated based on „Base PPA rate (%)”
Sites to be added to „Sites” worksheet
- Source: almost all information is coming from Project Information Form (PIF) document
- Mandatory fields:
- ID: Must be unique, to be added manually.
- Site name, Short Name
- System Owner; values are listed from „Companies” section, from „Clients” worksheet
- Time Zone
- Minimum Irradiance Threshold
- Graph kW Max Type: DYNAMIC / INV O/P / FIXED
- Site Street Address, Site City, Site State, Site State, Site Postal Code, Site Contact
- Contact Email,
- Optional fields
- Graph kW Max, Graph W/m2 Max, Occupancy Count, Square Footage
- Contact Phone, Nearest Weather Station
- Client Access URL
- Comments
-
Technical / administrative fields to be left blank
-
Deleted Dev?
-
Deleted Test?
-
Deleted User?
-
Systems to be added to „Systems” sheet
Each system must have general system information
- Source: almost all information is coming from Project Information Form (PIF) document
- Mandatory fields:
- System ID: Must be unique, to be added manually.
- Site name: values are listed from „Sites” sheet
- Parent system: vales are listed from „Calculated System Label”
- Utility Meter #
- Project Installer, O&M Company: values are listed from „Clients” sheet
- System Start, Publish On
- COM ERR Timeout (min)
- Latitude, Longitude
-
Optional fields
-
Derate Factor, Temp Coefficient
-
-
Calculated fields
-
Calculated System Label; based on „Site name” and „System Description”
-
-
Technical / administrative fields to be left blank
-
Deleted Dev?, Deleted Test?, Deleted User?
-
Do not modify system IDs for existing, already deployed systems. Mark them deleted and add new ones taking new, unused IDs in the database.
Devices to be added to „Systems” sheet
Each device must be listed for each System (as a separate row)
- Source: almost all information is coming from Project Information Form (PIF) document
- Mandatory fields:
- Device ID: Must be unique, to be added manually.
- Device Type: Cell Temp / Cluster Controller / Module / Monitoring / Inverter / Inverter Monitor / Master Meter / Racking / Transformer / Site Net Meter / Irradiance / Revenue Grade Meter / Site Net Meter / Virtual Irradiance Meter / Virtual Master Meter
- Device MFR; values are listed from „Equipment Manufacturers” / „Name” from „Manufacturers” sheet
- Gateway MFR: values are listed from „Manufacturers” sheet
- Device Model
-
Technical / administrative fields to be left blank
-
Device Paused?, Device Deleted?
-
-
Optional fields
-
Parent device
-
Device Tag Type: AE (Absolut Energy), P (Power), IRR (Irradiance)
-
Device Role: GRID NET / PV Output / SITE LOAD
-
Production Device Type: PRIMARY / SECONDARY
-
Data Transformation Recipe: INVERSE
-
Presentation DTR
-
Wattage, Device Count, Azimuth, Tilt, Tilt, Tracker, Voltage
-
Phases
-
Custom Online Readout Credentials, Description/Comment, Shared Online Readout Credentials
-
Number of inverters to be checked, and be registered as separate devices
Name of subsystems must be unique; to be registered like Inverter A/1, A/2 and B/1, B/2
Plane of Irradiance (PoA) meter (if any) must also be integrated and irradiance figures must be validated
Do not modify devices IDs for existing, already deployed devices. Mark them deleted, add new ones taking new, unused IDs. Make sure eGauge base URL is used. (Check one the existing eGauge devices and take that URL format as a baseline pattern.)
For eGauge meters, each register to be registered as separate device in Mana, like usage, generation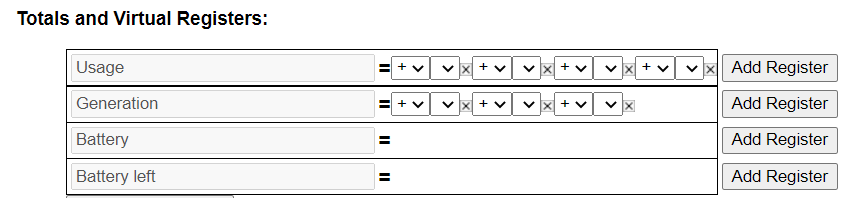
SolarEdge solar production and consumption configuration
- On site level
-
-
- For solar production, always load "site energy" regardless there's any production meter and as delta energy
Device Type: Master Meter
-
- Device Tag Type: DE
- Device Role: PV OUTPUT
- Production Device Type: PRIMARY
- Device MFR, Gateway MFR: SolarEdge
- Custom Online Readout Credential XML: {"solarEdgeSiteId":"XXX", "queryType": "SITE_ENERGY", "apiKey": "XXX"}
-
- For consumption, always load it as delta energy

-
- Device Type: Revenue Grade Meter
- Device Tag Type: DE
- Device Role: SITE LOAD
- Production Device Type: PRIMARY
- Device MFR, Gateway MFR: SolarEdge
- Custom Online Readout Credential XML: {"solarEdgeSiteId":"XXX", "queryType": "SITE_ENERGY", "apiKey": "XXX"}
-
- For solar production, always load "site energy" regardless there's any production meter and as delta energy
-
-
- On inverter level
-
-
- Both absolute energy and power to be loaded
-

-
-
Device Type: Inverter Monitor - Device Tag Type: AE, P
- Device Role: PV OUTPUT
- Production Device Type: PRIMARY
- Device MFR, Gateway MFR: SolarEdge
- Custom Online Readout Credential XML:{"solarEdgeSiteId":"xxx","inverterSerialNumber":"xxx", "timeZone":"US/Pacific"}
-
-
- Time zone to be specified only if it's not Pacific / Hawaii (UTC-10 hours)
-
-
-
-
-
-
Enphase solar production configuration
- In case of having an Enphase Production Meter; i.e. Revenue Grade Meter
-
-
- Both direct energy and power to be loaded
-
Two separate devices to be registers; one Revenue Grade Meter and one Inverter
-
Revenue Grade Meter
- Device Type: Revenue Grade Meter
- Device Tag Type: DEP
-
Revenue Grade Meter
-
-
- Device Role: PV OUTPUT
- Production Device Type: PRIMARY
- Device MFR, Gateway MFR: Enphase
- Device Model: RGM
- Device Count: 1
- Custom Online Readout Credential XML:{"EnphaseJsonDeviceConfig":{"enphaseId":xxx,"accessId":xxx,"endpointType":"RGM_STATS", "sampleRateMinutes":15, "loadFrequencyMinutes":60, "loadDelayMinutes":15}}
-
Inverter
- Device Type: Inverter
- Device MFR, Gateway MFR: Enphase
- Device Model, Wattage STC, Device Count: as per site / Enphase information
-
-
-

- In case of not having Enphase Production Meter
- Both direct energy and power to be loaded
-
Device Type: Revenue Grade Meter
-
Device Tag Type: DEP
-
Device Role: PV OUTPUT
-
Production Device Type: PRIMARY
- Device MFR, Gateway MFR: Enphase
- Device Model, Wattage STC, Device Count: as per site / Enphase information
- Custom Online Readout Credential XML: {"EnphaseJsonDeviceConfig":{"enphaseId":xxx,"accessId":xxx,"endpointType":"STATS", "sampleRateMinutes":15, "loadFrequencyMinutes":60, "loadDelayMinutes":30}}
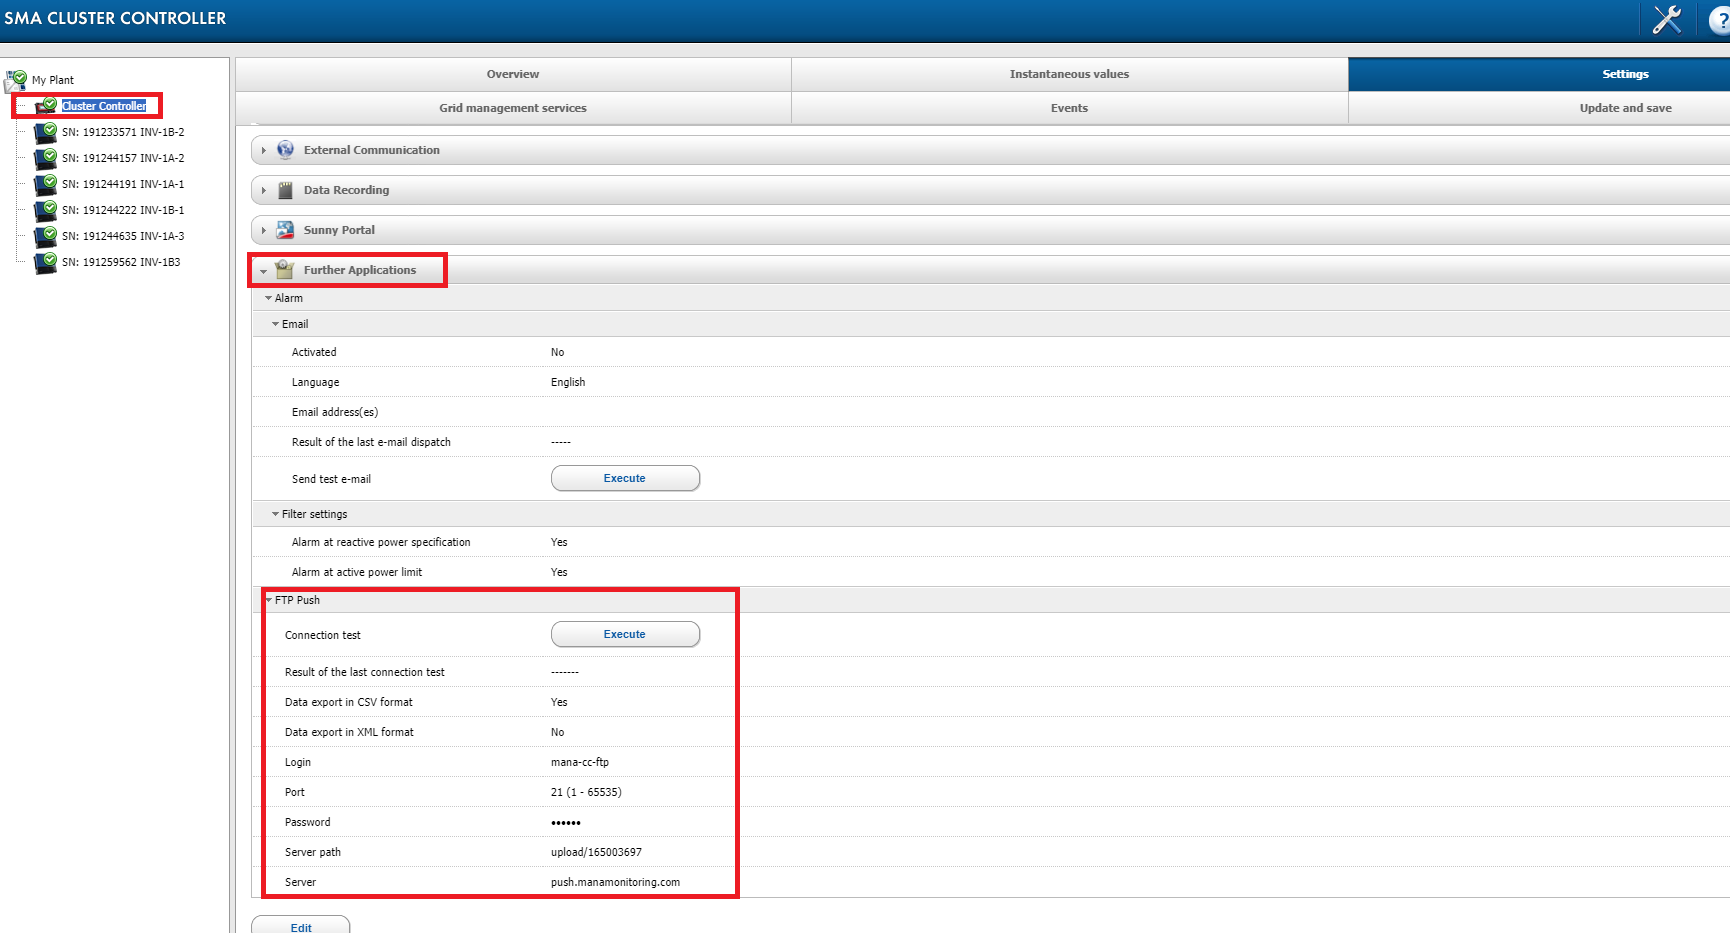
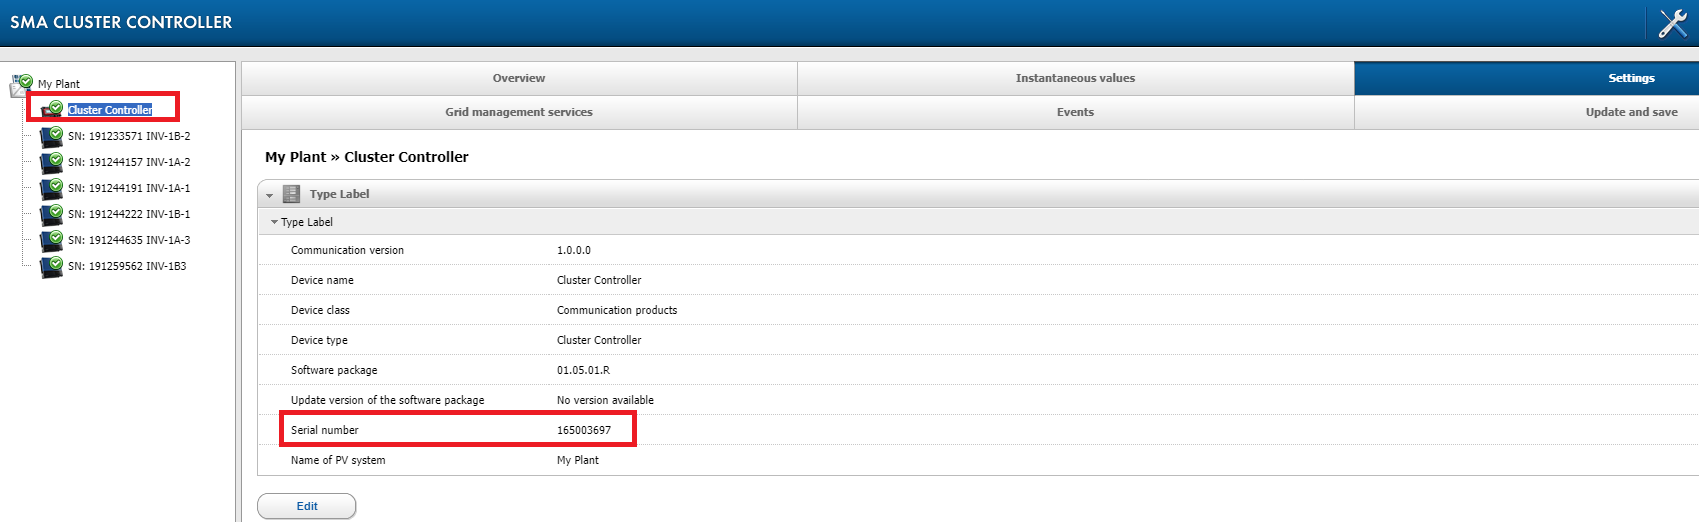
SMA Cluster Controller solar production configuration
- Activities to be done in SMA Cluster Controller
-
-
- Further applications section to be configured in Cluster Contoller
-
- Data export in CSV format: Yes
- Login: mana-cc-ftp
- Port: 21
- Password: M@n@!234
- Server path: upload/xxx
-
- xxx: Cluster Controller's Serial number
-
- Server: push.manamonitoring.com
-
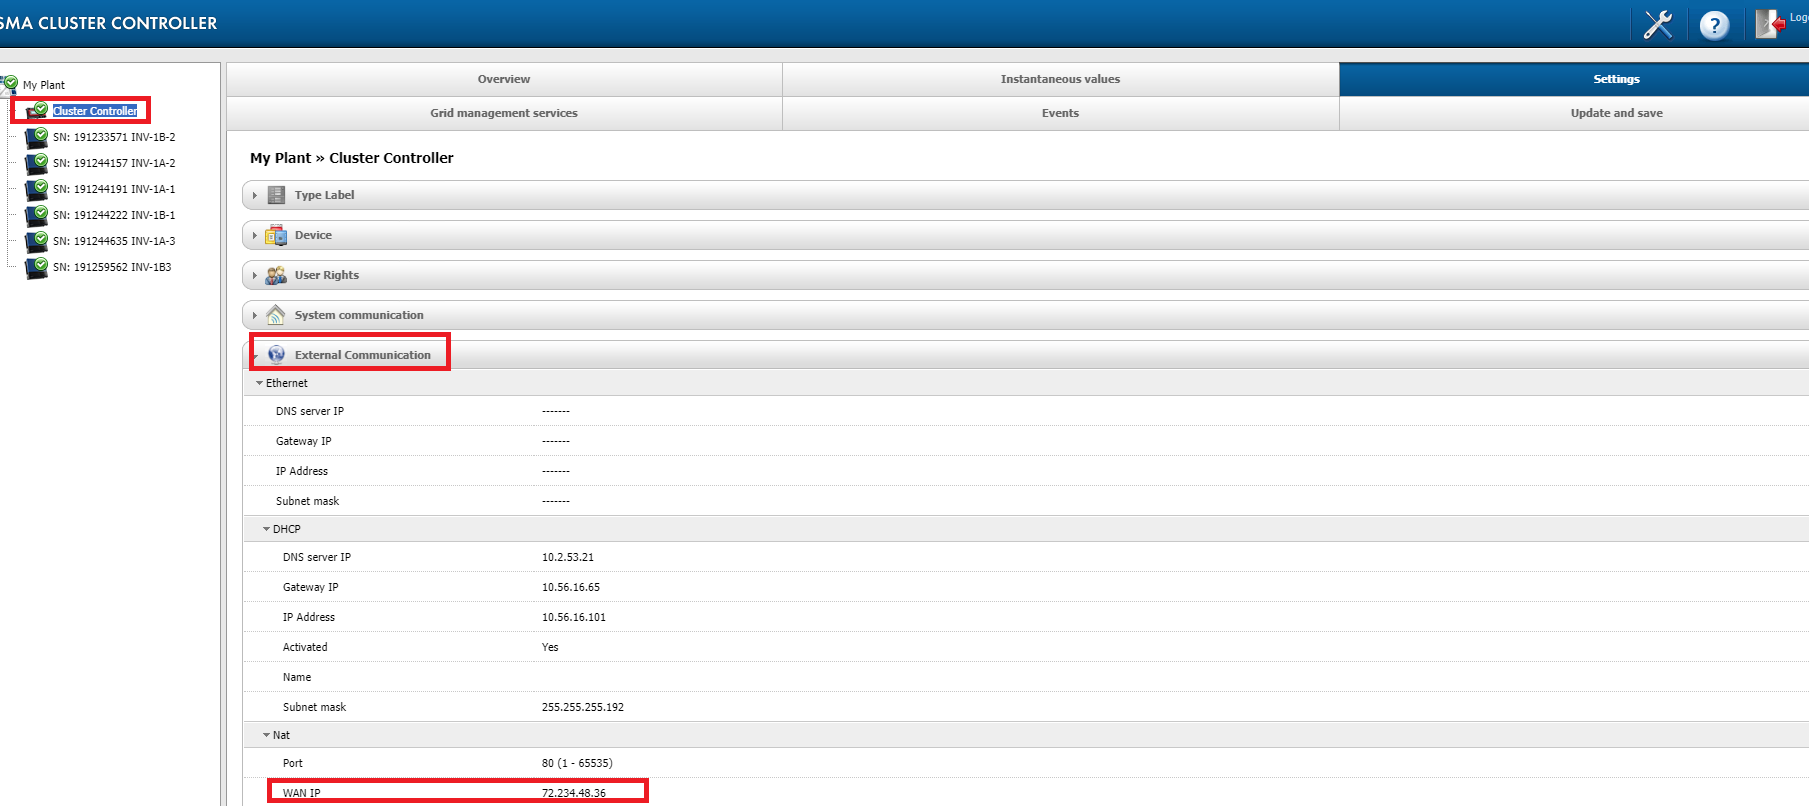
- Further applications section to be configured in Cluster Contoller
-

- WAN IP address to be shared with developers to make it a whitelisted IP address
-
-
-
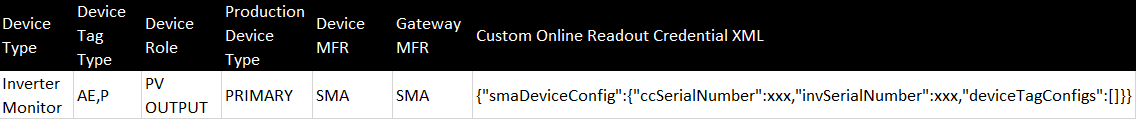
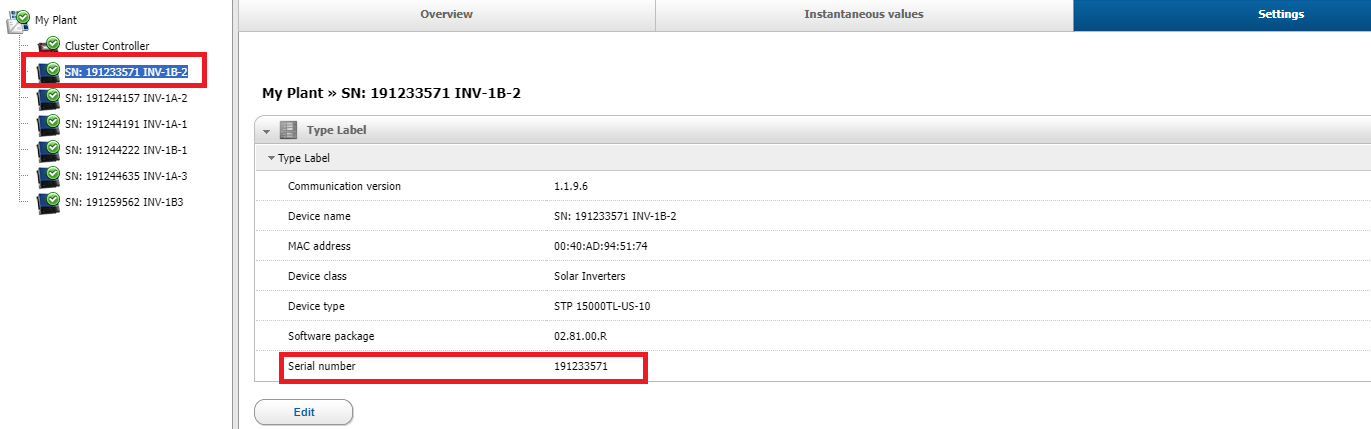
- On inverter level
-
-
- Both absolute energy and power to be loaded
-

-
- Device Type: Inverter Monitor
- Device Tag Type: AE, P
- Device Role: PV OUTPUT
- Production Device Type: PRIMARY
- Device MFR, Gateway MFR: SMA
- Custom Online Readout Credential XML: {"smaDeviceConfig":{"ccSerialNumber":"xxx","invSerialNumber":"xxx","deviceTagConfigs":[]}}
-
-
- ccSerialNumber is the Cluster Controller's Serial number

- invSerialNumber is the respective inverter's Serial number

- ccSerialNumber is the Cluster Controller's Serial number
-
-
-
-
-
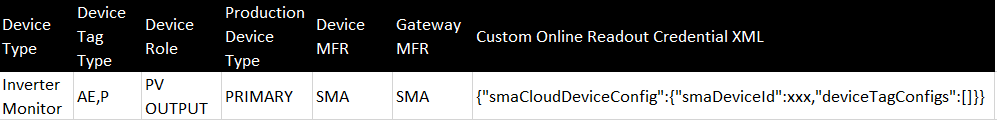
SMA Sunny Portal / ennexOS API solar production configuration
- On inverter level
-
-
- Only Direct Energy (DE) to be loaded
-

-
- Device Type: Inverter Monitor
- Device Tag Type: DE
- Device Role: PV OUTPUT
- Production Device Type: PRIMARY
- Device MFR: SMA
- Gateway MFR: SMACloud
- Custom Online Readout Credential XML: {"smaCloudDeviceConfig":{"smaDeviceId":xxx,"deviceTagConfigs":[]}}
-
-
- Device ID from Sunny Portal / ennex OS
-
-
-
-
-
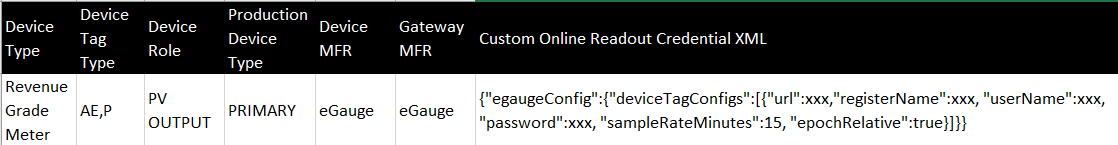
eGauge solar production configuration
- On inverter level
-
-
- Both Absolute Energy (AE) and Power (P) to be loaded
-

-
- Device Type: Revenue Grade Meter
- Device Tag Type: AE,P
- Device Role: PV OUTPUT
- Production Device Type: PRIMARY
- Device MFR, Gateway MFR: eGauge
- Custom Online Readout Credential XML: {"egaugeConfig":{"deviceTagConfigs":[{"url":xxx,"registerName":xxx, "userName":xxx, "password":xxx, "sampleRateMinutes":15, "epochRelative":true}]}}
-
-
- url: the link of eGauge device
- registerName: respective tag / register to be loaded
- userName / password: credentials towards eGauge device
-
-
-
-
-
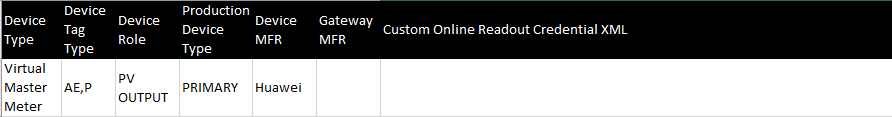
FusionSolar solar production and consumption configuration
- On site level
-
-
- For solar production, only Virtual Master Meter to be configured

-
- Device Type: Virtual Master Meter
- Device Tag Type: AE, P
- Device Role: PV OUTPUT
- Production Device Type: PRIMARY
- Device MFR: Huawei
-
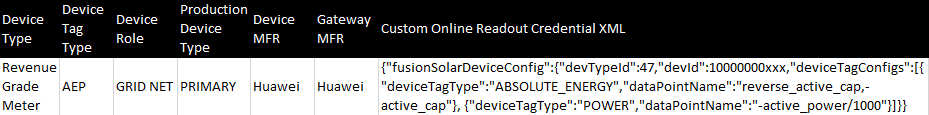
- For consumption, always load it as absolute energy & power
-

-
- Device Type: Revenue Grade Meter
- Device Tag Type: AEP
- Device Role: GRID NET
- Production Device Type: PRIMARY
- Device MFR, Gateway MFR: Huawei
- Custom Online Readout Credential XML: {"fusionSolarDeviceConfig":{"devTypeId":47,"devId":10000000xxx,"deviceTagConfigs":[{"deviceTagType":"ABSOLUTE_ENERGY","dataPointName":"reverse_active_cap,-active_cap"}, {"deviceTagType":"POWER","dataPointName":"-active_power/1000"}]}}
-
- devID last characters are coming from FusionSolar's link
-
- devID last characters are coming from FusionSolar's link
-
-
- For solar production, only Virtual Master Meter to be configured
-
-

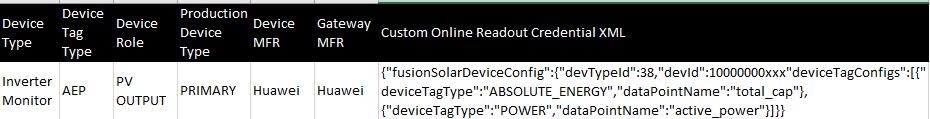
- On inverter level
-
-
- Both absolute energy and power to be loaded
-

-
- Device Type: Inverter Monitor
- Device Tag Type: AEP
- Device Role: PV OUTPUT
- Production Device Type: PRIMARY
- Device MFR, Gateway MFR: Huawei
- Custom Online Readout Credential XML: {"fusionSolarDeviceConfig":{"devTypeId":38,"devId":10000000xxx"deviceTagConfigs":[{"deviceTagType":"ABSOLUTE_ENERGY","dataPointName":"total_cap"}, {"deviceTagType":"POWER","dataPointName":"active_power"}]}}
-
- devID last characters are coming from FusionSolar's link
- devID last characters are coming from FusionSolar's link
-
-
-
-
-
- In case of "mixed" setup - i.e. there are AE and DE inverters on the same level of the hierarchy), than Device Tag Type must be DEP, P (please see Napili Shores)
New „Manufacturer” (if any) to be added to „Manufacturers” worksheet
- Source: information is coming from Project Information Form (PIF) document
- Mandatory fields:
- Code, Name
- kWh divisor: by default: 3600000
- Optional fields:
- Raw Data Schema
- Client Access URL
Manufacturer of newly added devices to be checked. If not existing, must be registered
New manufacturer must also be registered to the shared Initial Data file as well, Mana_InitialData_Shared RXXX.xlsx
Production estimates and Consumption estimates (if any) to be added to „Production Estimates” worksheet
- Source: almost all information is coming from Project Information Form (PIF) document
- Mandatory fields:
- System:
- Include: must be X in case of Enestar (as this flag drives the display)
- Type: „Monthly”; by default
- Data source
- Degradation factor
- JAN, FEB, …, NOV, DEC
- TOTAL: aggregate / sum of monthly production estimates
- Consumption estimates (if any) to be also registered here
- Mandatory fields:
- JAN, FEB, …, NOV, DEC
- TOTAL: aggregate / sum of monthly consumption estimates
How to review and validate new sites?
What kind of data do we need to check?
-
Double-check meta information; like system size on site level or device, technical information and credentials on device level
- Production characteristics to be checked, e.g.
- Time of sunset and timestamp of last production must be very close to each other.
- Peak production shall be around noon.
-
Production estimates information must be available
-
Checking system by system / device by device to confirm that
-
Status / communication status is matching with external monitoring site information
-
List of inverters must match
-
Comparing daily, monthly and yearly production figures with figures from external monitoring sites
-


External monitoring sites are directly accessible from give device (as seen above)
What kind of problems can we meet?
- Having „Communication error” status
- Having „Not producing” status
- Device is not accessible or available in external monitoring site
- Monthly production figures are not matching with external monitoring sites
- Inverter is not configured / available in Mana

Guide on how to resolve cases with "Communication error"
Inverter is without any reading, but continuously reporting in external monitoring sites
There might be cases inverter in without any reading at Mana, but continuously reporting in external monitoring sites
-
Potential root cause
- Credential information is not matching
- Inverter was changed by the customer / O&M company without informing us.
- API key can’t be leveraged to extract data as the site has a different owner
-
Action(s) to be taken
- Credential information to be updated accordingly the current set; i.e. to change and reset the inverter
Valid "communication error"
In case there’s no production information in external monitoring site, or eGauge inverter is not directly accessible; i.e. „Device egaugeXXX was not found on this server”
Potential root cause
- Valid communication / connection error; to be check onsite
Action(s) to be taken
- Nothing or inform the customer / O&M company
Guide how we are resolving cases when monthly figures are not matching with external monitoring sites
Improper and / or not matching credentials
Credentials in Mana do not match with the credentials in external / inverter monitoring sites
-
Potential root cause
- Typos / improper registration at Mana
- Inverter was changed by the customer without notifying us
-
Action(s) to be taken
- Credential information to be updated accordingly the current set; i.e. to change and reset the inverter
Production information is missing for a few days
There might be cases when daily production figures are not matching with the ones from external sites, as production information for one or a few days are missing
-
Potential root cause
- Communication error occurred in the last days
-
Minor differences (<1-2%) in case of eGauge due to time zone difference
- Weird Fronius API behaviour that resulted in that production information for a particular day didn’t synchronized
-
Action(s) to be taken
- Double-checking daily reconciliation issues under „Readings” / „Daily Summary”
- Generating a „Portfolio Overview” report for given site (and inverter) for the relevant period
- Checking „Validation results” and reloading data
- Details and screen shots in MANA-3884
Inverter network was offline for a certain period
If such case, but it was working meanwhile (i.e., its internal meter was counting), we experience a jump in the cumulative energy when the meter network re-establishes
Total energy that was produced during the offline period is booked to the first day after re-connection.
-
Pro(s)
- Energy produced during the offline period does not „vanish”
-
Cons(s)
- External / inverter systems, like SolarEdge doesn’t calculated the gap period to the yearly production that causes discrepancies.
Minor discrepancy to due different time zones in case of eGauge meters
Due to the normal behaviour of eGauge monitoring, production figures for a certain period might be different in eGauge and Mana platform due to time zone difference
But, difference must be less than 1-2% of the sum production during that period
Meter reset
If there has been a meter replacement, we need to forcibly remove the big jump from cumulative energies which is implicitly caused by the fact that a new meter usually starts from 0 or from a certain start number, which has no relation to where the previous meter has ended
-
Pro(s)
- Mana figures are in line with external / inverter system figures
-
Cons(s)
- Total production that took place during the offline period is blanked out
External monitoring sites
-

- https://www.egauge.net/
- No credentials needed for most of the cases. If needed, can be retrieved from Initial Data.
-

- https://enlighten.enphaseenergy.com/
- username / password: zoltan@manamonitoring.com / Mana1234
-

- username / password: zoltan@manamonitoring.com / Solar123!
-

- https://monitoring.solaredge.com/solaredge-web/p/login
- username / password: zoltan@manamonitoring.com / MHS2020!
-

- https://la5.fusionsolar.huawei.com/
- username / password: ManaMonitoring / octubre01
Site Status Questions
For an overview of system status icons visible on the map, see: Portfolio Overview Map in the Mana User's Manual.
To read about how system status is determined, see: System Statuses and Icons in the Mana User's Manual Appendix.
The purpose of this document is to demonstrate the tools available in order to understand why a system has a certain status. We will use an actual issue as an example, described in MANA-3890 Improper (?) "Not producing" status regardless there's production figures - Maui Cost Hotel (Restaurant)
A good tool to understand why a system has a certain status is the System Status History page, which can be opened from the Site Details page:

For a subsystem, only the first three columns are relevant:

For an aggregator system, you can also see the number of subsystems producing, not producing, and having communications errors. For this given system, we can see that it last entered NOT PRODUCING at 8:03 p.m. local time, because the energy generated that day (as far as we know at that time) was 0 kWh. So the algorithm determined site status as described in case #7.1 of the System Statuses and Icons chapter in the Mana User's Manual appendix.:
7. Site last reported after the solar day end (minus a dawn/dusk offset*7), and...
1. If performance ratio is unavailable for today and the energy generated today is less than what the site is expected to produce in a day*5 then: NOT PRODUCING
2. If performance ratio IS available for today, then we compare that to the site Not Producing Threshold Pct*6. In other words, if the performance ratio for today was below the threshold percent, then the site status is: NOT PRODUCING
8. If site last status was NOT PRODUCING then we stay with that until production exceeds the threshold (see MANA-2371 to understand why this is required)
We can then check when we received data for this day on the Readings → Local Readings page:


We can see that we started receiving data for 5/16 at 8 p.m. that day site time. Because it takes around 60 minutes to aggregate values currently:

So this is why at 8:03 p.m. the system went to NOT PRODUCING.
A proper solution with sites like this, where data is only reported sporadically, is to increase the site not producing notifications to 1440 minutes:


This way the site status determination will change. Particularly the following will be checked:
6. When the timeout is at least 1440 minutes (1 day)
and the energy generated yesterday is more than what the site is expected to produce in a day*5 then:
1. NORMAL/OVER-/UNDER-PRODUCING (see step #9 below for criteria)
2. or the Site last reported before the solar day end yesterday (minus a dawn/dusk offset*7), and yesterday the site was fine, then don't change the site status (until the morning at least)
So in effect we will only go to NOT PRODUCING if the site hasn't reported readouts for yesterday by the morning, or if those readouts indicated very low energy production yesterday.
See the section Rules for systems where the NOT PRODUCING Notifications Timeout is at least 1 day in the System Statuses and Icons chapter Mana User's Manual Appendix for more information.
Data "Aggregation" Algorithms
Overview
"Backend" Algorithms
"Back-end" components are responsible for the retrieval of data from the physical devices. These components also manipulate the data in such a way that irrespective of the format and specifics of the "raw" data read from the devices, the data stored in the "readout" tables in the main site database is consistent. For example, an actual device may report energy in kWh, however these values are manipulated by the back-end so that the numbers in the "readout" tables represent Joules. The actual timestamp of the data may also be manipulated by the backend so that the data in the readout tables always comes with a timestamp that falls on regular intervals. So a data that actually refers to a reading taken at 14:00:24.0212 is actually stored in the readout tables with a timestamp of 14:00:00. This makes it easier for subsequent calculations to run, and for the data to be graphed etc.
"Site" Algorithms
The data loaded by the backend into the readout tables is then "aggregated" by algorithms (stored routines) in the site MySQL databases. We've internally referred to the process of data-processing done mainly within the site MySQL databases as "data aggregation." A more appropriate term would probably have been "data pre-processing" since aggregation is only a part of the transformation done by the site to ensure that the readout data is in a suitable format for consumption by the website.
Essentially, the following calculations/transformations are done:
- Device-specific data is "aggregated" up to hourly, daily, monthly values
- Device-specific data is combined to form "system-level" readings, so for example, a given system may have a reading at 14:00 which includes the data from devices measuring momentary power, cumulative energy, temperature, irradiance, etc.
- "System-level" readings for subsystems (systems with parent systems) are aggregated together to obtain "aggregator-system" readings. For example, if a site has 3 subsystems, then the energy readings for a given moment are added together to obtain the energy reading for the whole site at that moment in time.
- Certain values are calculated from the different types of readings, such as: estimated energy, effective availability, weather-corrected predicted power.
Manual Data Reaggregation
Occasionally it may become necessary to manually "re-aggregate" our data for a given device/system. Some scenarios which might lead to this:
- Readout data is updated without subsequently notifying the aggregation algorithm of this fact
- Some parameters of the site were input incorrectly, such as inverter count etc.
- Previous irradiance data is attached to a site manually (for example a virtual irradiance device)
In such cases the "raw" data retrieved from the devices is correct in the master (MySQL) database, however calculated and aggregated values are not. Such values include:
- Calculated values such as predicted energy, performance ratio, effective availability
- Daily or monthly aggregated values (which appear in reports and on various parts of the site)
- "Site Aggregator" system data, in other words, data stored for "Virtual Master Meter" type devices
To manually trigger a full "reaggregation" of all data for a system, log into the website as Demo or Zoltan, and open the site details page for the given energy site.
To reaggregate a specific device, look for the "Reaggregate Device" button:

To reaggregate the entire site, look for the link at the bottom of the page:

You can also click "Aggregation Log" to review aggregation events.
The process may take several minutes to complete. Once done, you should see "success: true":

The pop-up does not need to be open for the process to complete.
If there are many systems/subsystems, then don't wait for a result in the pop-up. Instead, close it and open the aggregation status page:

You can then see all of the devices marked for complete reaggregation:

You will know that the reaggregation has completed once the list empties and instead you see the reloaded devices under "Completely reaggregated:…".
Automatic Data Integrity Checks and Reaggregation
The aggregation algorithm runs semi-continuously and attempts to keep aggregated data up-to-date. It checks whether any new records have been added to the database since the last time it aggregated data for the given device. It can also be manually notified of any "back-loading" events where for some reason we updated past values in the database (that have already been aggregated).
However, it is still possible for aggregate data to be incorrect. For example, if previously aggregated readout data is manually altered, or rewritten by the back-end without notifying the aggregation algorithms of the "back-load" event. There may also be "bugs" in the aggregation algorithm that we haven't yet uncovered leading to incorrect aggregate values. To try and mitigate such issues, one algorithm (sp_identify_full_reaggregate_candidates) runs once every night and attempts to identify any incorrectly aggregated values, or missing aggregate data. It then flags the associated devices to be completely re-processed by the aggregation routines.
Currently this routine checks for the following issues, however, it could be improved upon and further checks could be added.
The first round of checks is fairly simple and as such completes fairly quickly:
- First device_readout_daily does not match date of first readout: we have readout data in device_readout or DER, however values are missing in DRD completely, or the first day that we have values for is after the day of the first energy readout. Also check if we have data in DPR, but we don't have aggregated power values for that day in DRD.
- First system_production does not match first readout: same as the previous check (First device_readout_daily does not match date of first readout), except that instead of checking DRD, we are checking SPD.
- First system_consumption does not match first readout: same as above, except that we are checking SCD for PRIMARY SITE LOAD type devices and associated systems.
- First system_net does not match first readout: same as above, except that we are checking SND for PRIMARY GRID NET type devices and associated systems.
Abbreviations used:
- DR: device_readout
- DER: device_energy_readout
- DRD: device_readout_daily
- DPR: device_power_readout
- SPD: system_production_daily
- SCD: system_consumption_daily
- SND: system_net_daily
A second round of tests loops over any devices not identified in the first round. These tests take a long time to run so they are not set to run automatically, however, parameters can be set in the routines to force the checks to run. Here we loop through each device and first identify if there are any "gaps" in the daily aggregated values:
- device_energy_readout exists but device_readout_daily does not
- - or - device_readout exists but device_readout_daily does not
- device_energy_readout exists but system_production_daily does not
- - or - device_reaodut exists but system_production_daily does not
- device_energy_readout exists but system_consumption_daily does not
- - or - device_readout exists but system_consumption_daily does not
- device_energy_readout exists but system_net_daily does not
- - or - device_readout exists but system_consumption_daily does not
- device_celltemp_readout exists but device_celltemp_readout_daily does not
- device_irradiance_readout exists but device_irradiance_readout_daily does not
- device_power_readout exists but device_power_readout_daily does not
- sp_identify_full_reaggregate_candidates
Initial Data
Adding New Client to ID Demo
(1) Set the new company's ID to the ID of the latest company minus 10000000:

(2) Create a copy of the newest Sites worksheet and update the ID values in the header by subtracting 10000000:
 →
→ 
(3) Create a copy of the newest Systems worksheet and update the ID value in the header by subtracting 10000000:
 →
→ 
Company Logos
Uploading Company Logos
(1) Log into the MANA-01 laptop via SplashTop
(2) Place the new logo into the C:\Mana\Company Logos folder
For consistency and to avoid any issues, it is recommended that you remove any spaces and special characters (other than "-" or "_") from the filename and change all letters to lower case.
(3) Start the FileZilla FTP client
It's pinned to the taskbar:

(4) Click "Connect"
On startup, the Site Manager is shown, currently there is only one FTP Profile so it is automatically selected, you only need to click "Connect":

(5) Double-click the new file from the middle-left pane
The leftmost window shows the local filesystem, the middle-left window shows all files in the selected local folder.
The rightmost window shows the remote filesystem (on the server), the middle-right window shows all files in the selected remote folder.
You can double-click a local file to upload it, or double-click a remote file to download it.
You can also toggle directory comparison mode and synchronized browsing using buttons at the top:


(6) Check Your Work
The newly uploaded file should be available from: https://user.manamonitoring.com/images/company-logos/xyz.abc where xyz.abc is the name of the file you uploaded.