FAQs
- How do I identify site issues?
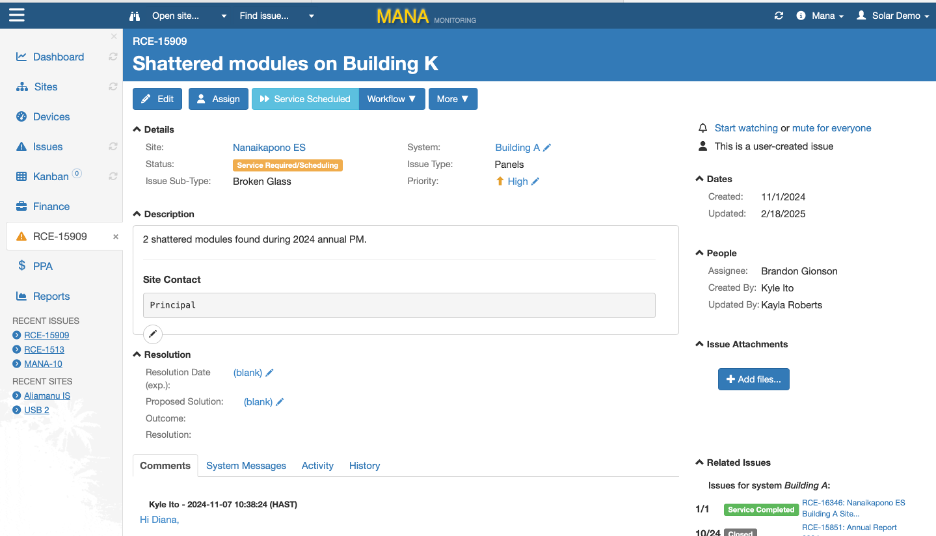
- How do I work with issues assigned to me?
- How do I calculate the carbon equivalent of solar PV production?
- How do I configure notifications?
- How do I calculate effective availability?
- How do I calculate performance ratio?
- How do I export production data?
- How do I add tags to sites?
How do I identify site issues?
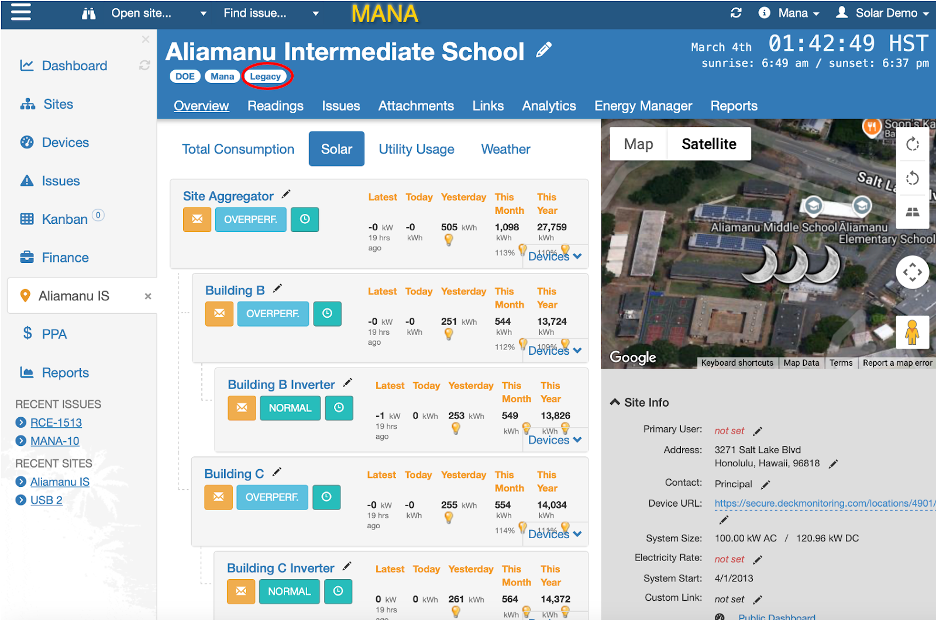
A starting point is the overview map on the dashboard and checking new notifications at the bottom of the page .
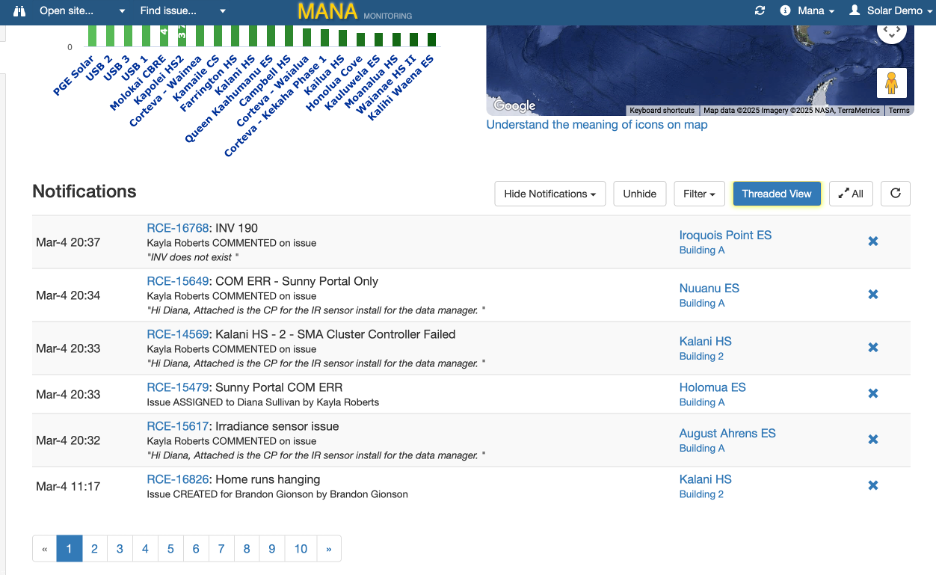
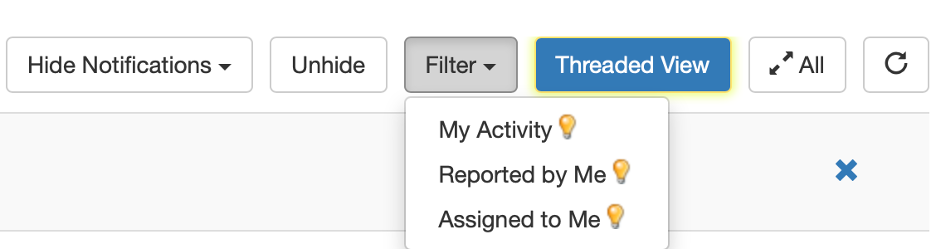
The filter bar allows users to view specific notifications that have been assigned to them.
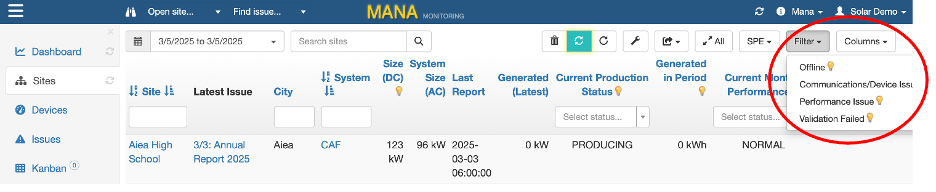
Users can also open the sites list and using the Filter drop down to search for sites that are Offline, have Communications/Device Issues, or Performance Issues.
The user can also use the Issues tab or the Kanban to review recently generated system issues.
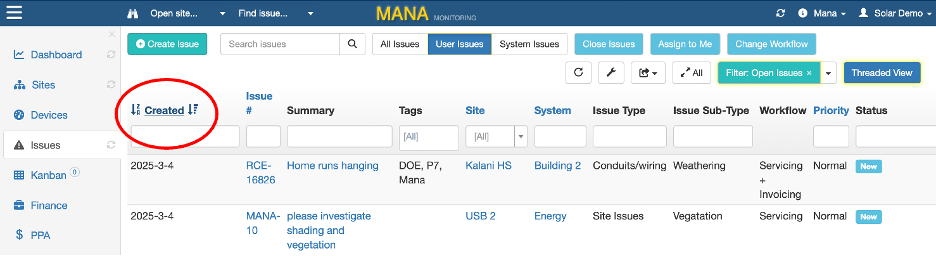
On the issues tab, issues are listed in order of those most recently published by default. However, selecting the "Created" label allows users to re-order them to list older issues first if necessary.
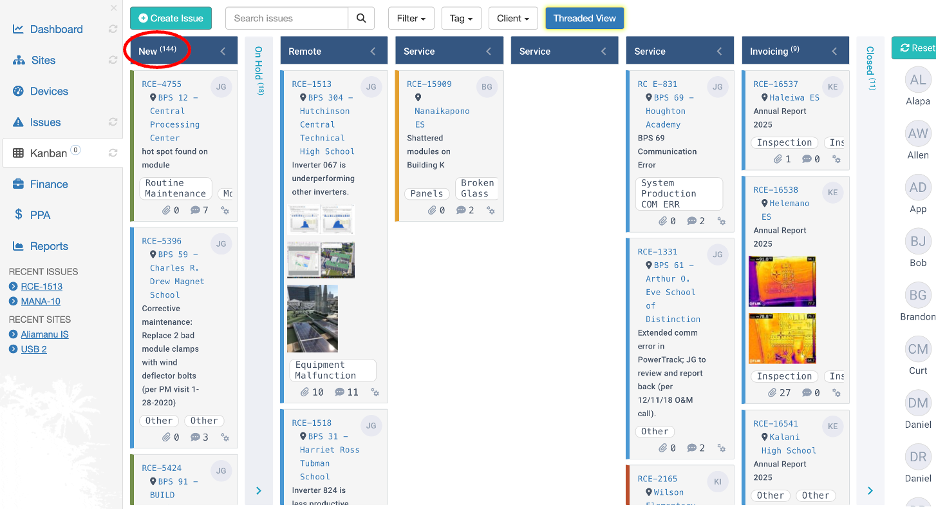
On the Kanban tab, new issues are listed on the left.
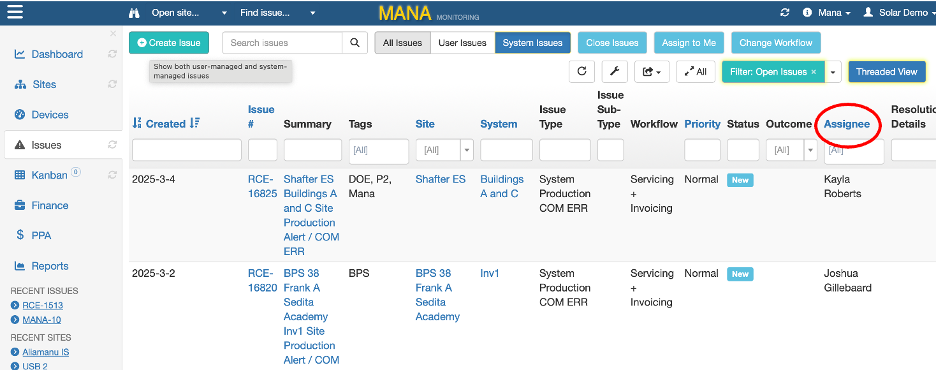
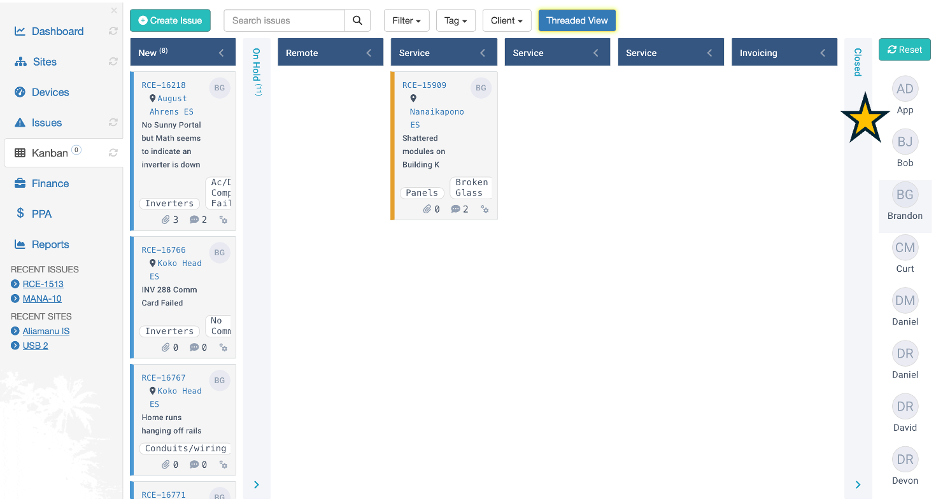
How do I work with issues assigned to me?
How do I calculate the carbon equivalent of solar PV production?

To Calculate the Carbon Equivalent of Solar Photovoltaic production Mana uses the Environmental Protection Agency's (EPA) published formula:
Emission Factor
1,559 lbs CO2/MWh × (4.536 × 10⁻⁴ metric tons/lb) × 0.001 MWh/kWh = 7.07 × 10⁻⁴ metric tons CO2/kWh
Mana's algorithm takes the aggregate value of all the renewable energy produced in the current year to date, and uses the aggregate kWh value to calculate the carbon equivalent.
For more information visit:
https://www.epa.gov/energy/greenhouse-gases-equivalencies-calculator-calculations-and-references
How do I configure notifications?
Notifications can be delivered via email or reviewed on the Mana Website.
On the website, you can see your most recent notification on the Dashboard page. You can also hide any notifications that you've read.

Issue Notifications
You can opt to receive notifications of the following issue-related events:
| Notification Type | Explanation |
| Issue Created for Me | When a new issue is created, the system sends a notification to the assignee. |
| Issue Assigned to Me | When an existing issue is assigned, the system sends a notification to the new user. |
| Issue Status Changed | When an issue status is changed, the system sends notifications to the issue creator and assignee. |
| Issue Deleted | When an existing issue is deleted, the system sends notifications to the issue creator and assignee. |
| Issue Comment Added | When a comment is added to an issue, the system sends notifications to the issue creator and assignee. |
System Status Notifications
You can opt to be notified of the following types of system-related events:
| Notification Type | Explanation |
| System Production COM ERR | The system production meter status has been COM ERR for a certain amount of time. |
| System Production NOT PRODUCING | The system production meter status has been NOT PRODUCING for a certain amount of time. |
| System Production COM ERR Resolved | The system production meter status was COM ERR but has returned to NORMAL. |
| System Production NOT PRODUCING Resolved | The system production meter status was NOT PRODUCING but has returned to NORMAL. |
| System Consumption COM ERR | The system consumption meter status has been COM ERR for a certain amount of time. |
| System Consumption COM ERR Resolved | The system consumption meter status was COM ERR but has returned to NORMAL. |
System Performance Deviation Notifications
You can opt to be notified of the following types of system-related events:
| Notification Type | Explanation |
| System Production DEVIATION | System momentary power production has deviated from predicted power by a certain amount for at least a certain amount of time. |
| System Production DEVIATION Resolved | System momentary power production had deviated previously, but has now returned to within the expected envelope for a certain amount of time. |
The methodology for determining whether a system is deviating from expected is as follows:
Production Performance = Momentary Actual Power Reading / Predicted Power
If the production performance falls below the minimum threshold (%) or exceeds the maximum threshold (%) for a certain amount of time (the duration threshold), then an issue is created and a notification generated.
You can review the momentary actual power vs. predicted power on the analytics page for the given system, just make sure the "Predicted Power" series is on:

If you are an administrator, refer to the Mana Administrator's Manual, System-specific Issue Generation Settings for a technical overview of how issue generation and notifications work, or the System Statuses and Icons chapter to understand when a system status change occurs that can trigger a notification.
Enabling/Disabling Notifications for a System
The different types of notifications that can be automatically generated for a system can be turned off for a given system.
Note that if you turn off a type of notification for a system, then such notifications will also be turned off for the subsystems of that system as well!
To set these system-specific settings, open the site details page (from the sites list page or using the sites quick-access drop-down). Then, click on the little envelope next to the given system:

You can turn COM ERR and/or NOT PRODUCING notifications on or off, and you can also set a timeout. For an overview of the options available, see System-specific Issue Generation Settings in the Mana Administrator's Manual.
A Word on Timeouts
There are two timeouts that affect system status notifications.
First, the website can be configured to wait a specified amount of minutes before setting a system's status to COM ERR. This is to allow some lag in communications between the device(s) and Mana. This timeout can be set on the system form:


Second, the website can be configured to wait a specified amount of minutes after a system has stopped reporting before creating a COM ERR issue. Similarly, a timeout can be set after a system has stopped reporting non-null values before a NOT PRODUCING issue should be created.
Note that the issue generation timeout is not in addition to the COM ERR timeout, but the COM ERR timeout must elapse before a system state is set to COM ERR. In other words, the largest value set in either the system COM ERR timeout or the system COM ERR Notifications timeout must elapse before a COM ERR notification is created.
Notifications Q&A
We shall extend the notification threshold to 48 hours for Enphase, Fronius & APsystems sites. It shall be applied both for "communication error" and "not producing" notifications. Please let me know what needs to be configured
Answer: Depends on what you want. Assuming that a system hasn't reported for over a day, do you want:
- the system status to show COM ERR, you just don't want any issues created
- you want the system status to remain in whatever it was (normal/over/underproducing) for up to 2 days if readings aren't coming in (and since the status doesn't change, no notifications are sent)
If you want the system status (and icon on the map) to show that there is a COM ERR, but just don't want issues to be created (#1 above), then set the timeouts on the notification control panel for the system:
If you want the system status to stay in "PRODUCING" even if the system hasn't reported in over a day (#2 above), then just set the COM ERR timeout on the system form. I would start by just doing this, so just set the system COM ERR timeout to 2880 minutes on the system form:
This was the system should tolerate timeouts of at least this long before the status enters COM ERR or NOT PRODUCING. And since the system status doesn't change no issues should be generated.
Note for administrators: if this is what you do, then also update the timeout in ID!
f you set the timeouts on the notifications control panel for the system, then you don't need to update anything in initial data.
If you are an administrator, refer to the Mana Administrator's Manual, System-specific Issue Generation Settings for a technical overview of how issue generation and notifications work, or the System Statuses and Icons chapter to understand when a system status change occurs that can trigger a notification.
How do I calculate effective availability?
Effective Availability
EA Calculation
Effective Availability is calculated for each aggregator system as follows:
$$Ea\%\ =\ \frac{Energy\ Produced}{Energy\ Produced\ +\ Energy\ Lost}$$
It is calculated on a granular level (depending on the readout frequency, i.e. for every 5 or 15 minute period). The daily EA is calculated the same way but of course the values are for the whole day. The daily Energy Produced and Energy Lost values are determined by summing the values calculated on the granular level for the given day.
EA is only calculated "when the sun is shining", which means that if the site is not expected to be producing, then EA is not calculated at all for that 5 or 15 minute period. Irradiance as well as the current average power production of all subsystems are used to determine whether all subsystem of a given system are expected to be producing. This is necessary since we don't expect units to produce in the dark.
The exact algorithm to determine whether a system is expected to be producing is as follows:
If an irradiance threshold is not set for the site, or irradiance is unavailable,
and the sum of the average power of all subsystems during the previous period exceeds the minimum power threshold
→ then all subsystems are expected to be producing
Otherwise, if irradiance threshold is set for the site
and irradiance readouts are available
and the current measured irradiance exceeds the irradiance threshold
→ then all subsystems are expected to be producing
Otherwise
→ the site is not expected to be producing (no EA is calculated)The Minimum Power Threshold is determined as 1% of the sum of module outputs for the given system.
The Irradiance Threshold can be set on the site configuration form for the whole site:

Energy Produced is calculated simply as the sum of the readouts of all subsystems.
Energy Lost is calculated based on the energy produced by units (which we call subsystems) that are online, if available:
$$Energy\ Lost\ =\ Energy\ Produced\ *\ \frac{DC\ Size\ of\ Units\ Offline\ +\ DC\ Size\ of\ Units\ Not\ Producing}{DC\ Size\ of\ Online\ Subsystems}$$
DC size of units is determined from the Module Output of the system, which in turn is the sum Wattage * Device Count of all "Module" type devices registered to that system. In case of virtual aggregator systems, this value is calculated from its subsystems that do have modules.
A subsystem is considered online in the context of the above equation if it produced at least 0.5 kW over the preceding period at an average power of at least 0.1% of the rated module output.
A subsystem is considered not producing if it is reporting values, but these values are below the threshold explained above.
A subsystem is considered offline if readings are unavailable.
If no subsystems are online, then we use the predicted hourly output for the aggregator system to calculate the energy lost. The predicted hourly output for an aggregator system is calculated as follows:
$$\frac{System\ Size\ *\ Derate\ Factor\ *\ Irradiance}{1000} \ *\ ( 1-Temp.\ Coefficient\ *\ ( Celsius\ Cell\ Temp.-25))$$
We can then get the energy lost as follows:
$$Energy\ Lost\ =\ \frac{Predicted\ Hourly\ Energy\ Output}{60} \ *\ Minutes\ in\ Period$$
EA Visualization
The EA for each site is available from the Analytics tab on the site details page:

The values are also available in a table on the Local Readings tab for each site:

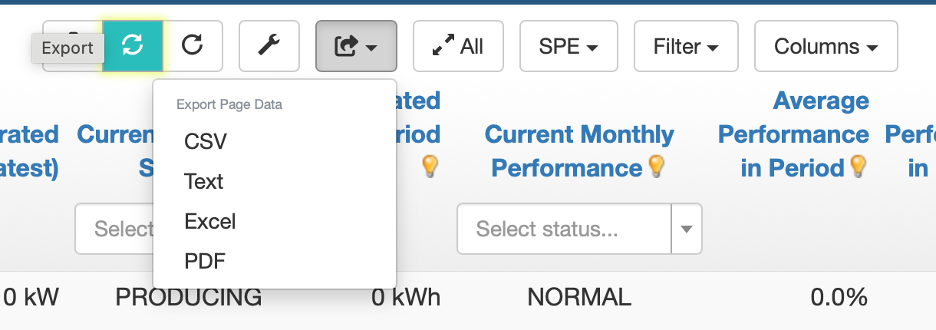
The result includes the values used in the calculation, and can be exported in various formats:

Use the Local Readings tab to drill-down and identify why the site underperformed on a given day (circled in the previous image):

How do I calculate performance ratio?
The Performance Ratio is the ratio of the energy effectively produced (used), with respect to the energy which would be produced if the system was continuously working at its nominal STC efficiency. The PR is defined in the norm IEC EN 61724.
The energy potentially produced at STC conditions is indeed equal to GlobInc * PnomPV, where PnomPV is the STC installed power (manufacturer's nameplate value). This equivalence is explained by the fact that at STC (1000 W/m², 25°C) each kWh/m² of incident irradiation will produce 1 kWh of electricity.
Therefore for a grid-connected system:
PR = actual energy / (irradiance * DC size)
Reference: https://jira.manamonitoring.com/browse/MANA-1531
Note, similar to Predicted Power, we have here instantaneous PR (kW%) and aggregated PR (kWh%)
PR is calculated when/if irradiance > 150w/m2, or the "Minimum Irradiance Threshold" set for the site.
The values are averaged to get hourly/daily values.
It is possible to review how PR was calculated by exporting "Combined System Readings" for the system that has irradiance data (usually the site aggregator):
Once you export it you can see exactly how the PR values are calculated.
Some notes:
- PR is calculated based on momentary Irradiance and momentary Power for instances in time when irradiance > 150 W/m2, averaged out for the day.
Example
Looking at Maemae Elementary, we see that PR is calculated as 266% for 9/1/2024:

To validate this number, we can export combined readings for this system and calculate manually ourselves:

In Excel, set a column to be calculated as Solar Power * 1000 / (Irradiance * 123.12).
123.12 is the DC size of the system:

The formula in Excel:

It is then easy to calculate the average PR value for the given day:

Settings that Affect PR
Parameters that affect PR calculation are: site DC size and the site irradiance threshold.
The Site Irradiance Threshold can be set on the site form:

If PR seems incorrect, then either these parameters are incorrect, or we are getting incorrect power or irradiance readings. If power is unavailable then the system uses average power, which comes from energy readouts so those may also be a culprit.
How do I export production data?
Exporting production data is simple and provides useful information about the performance of production sites.
Simply enter into the site tab and select the site or the group of sites you wish to export production data for. If the number of sites extends beyond multiple pages, make sure to select to include “All” sites in the report.
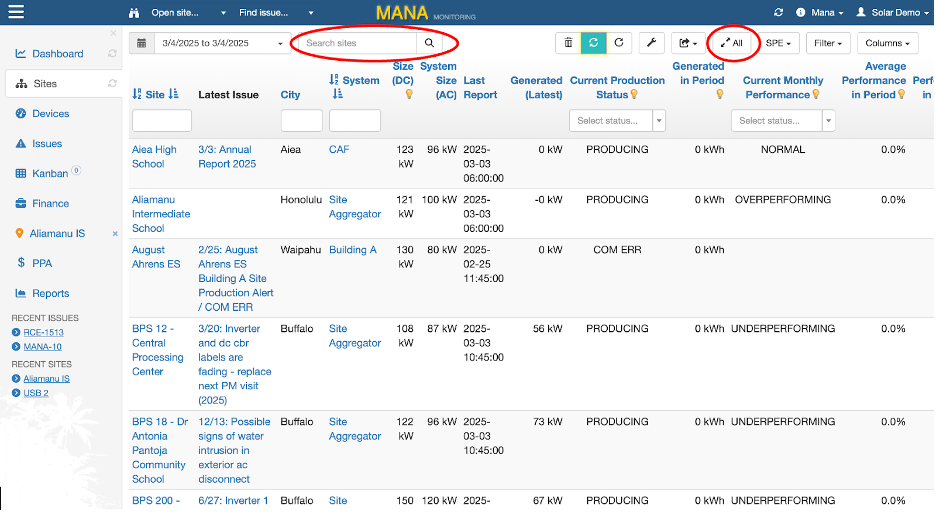
Then, simply select the format you wish for the data to be exported in.
How do I add tags to sites?
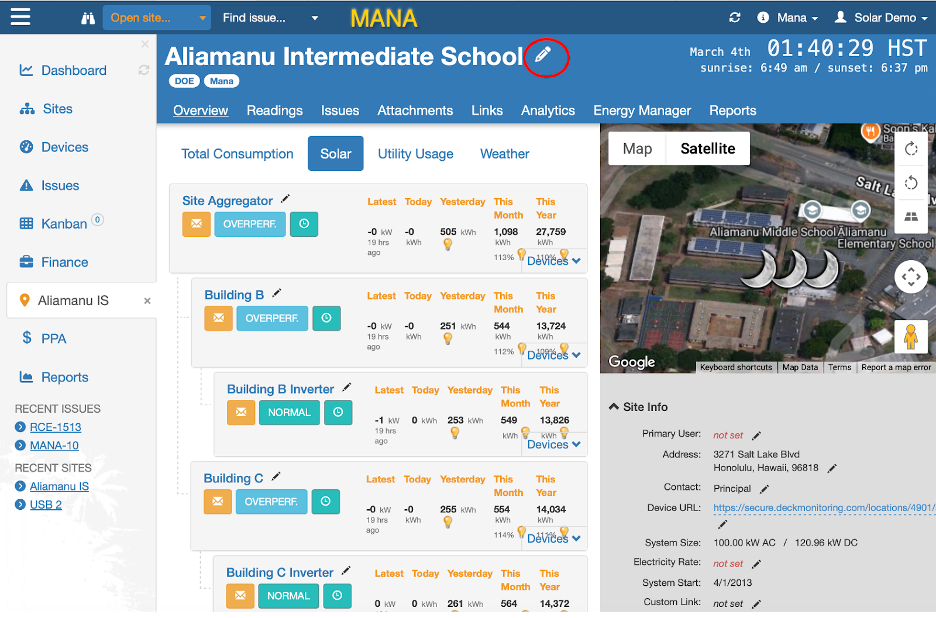
Simply enter into the name of the site that you wish to tag and select the arrow icon next to the name of the production site.
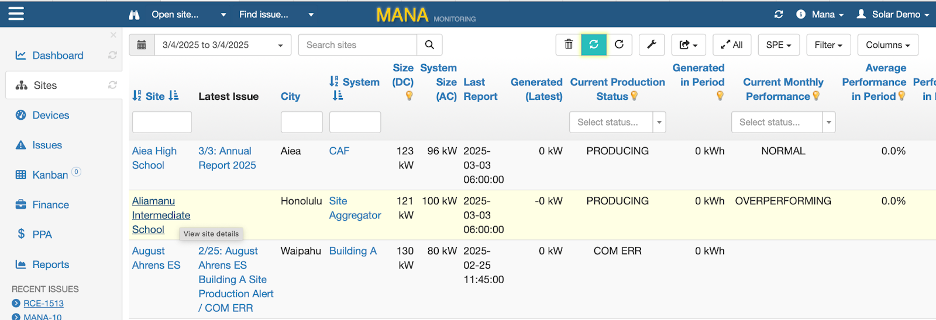
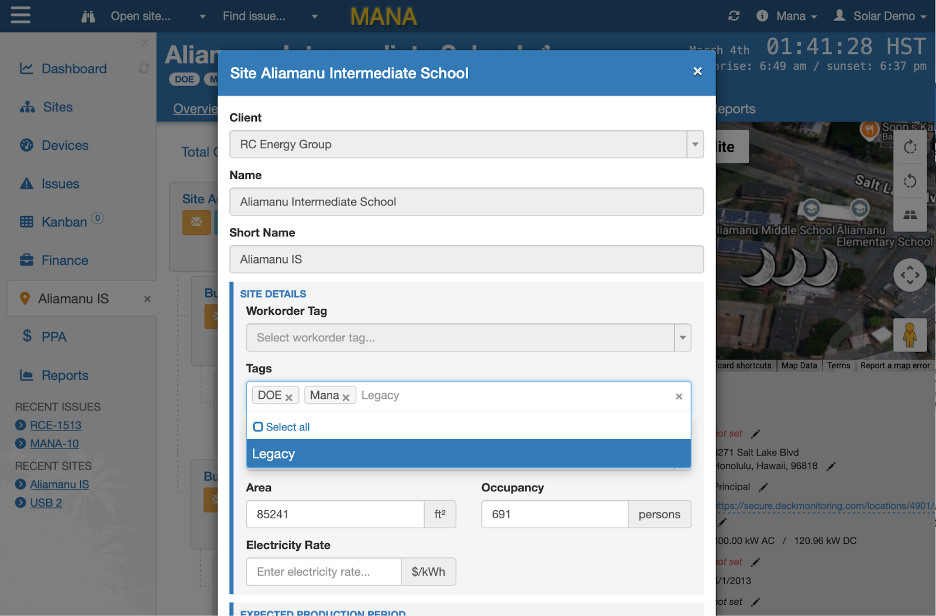
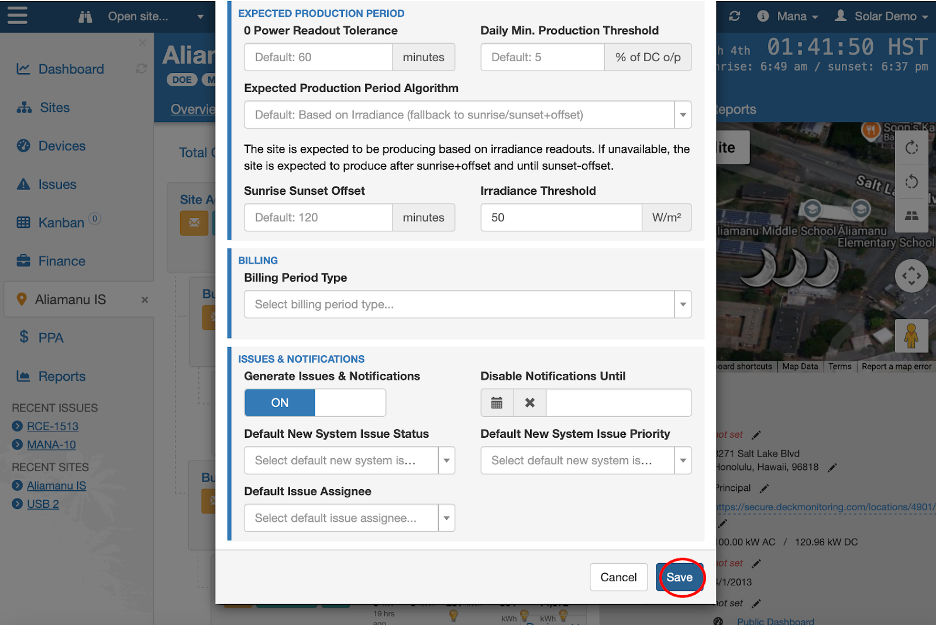
From here you can enter the name of the tag you wish to add. Make sure to save changes.
When you re-enter the site page, you can see that the tag now appears next to the name of the site and ensures that when the report is downloaded using this tag, this production site will be included.