Reports Tab
Overview
Mana makes a number of reports available to you depending on your subscription tier.
PPA and Tenant Billing Reports
-
Portfolio Batch Summary Report
Pre-configured PDF of PPA (power purchase agreement) bills that are compiled based on user defined portfolio/tags. -
Portfolio Summary Report
Pre-configured PDF summary of all the user defined billing(s) in a given portfolio -
Site PPA Contract
Pre-configured PDF PPA bill based on a site's energy purchase in a given period
General Reports
-
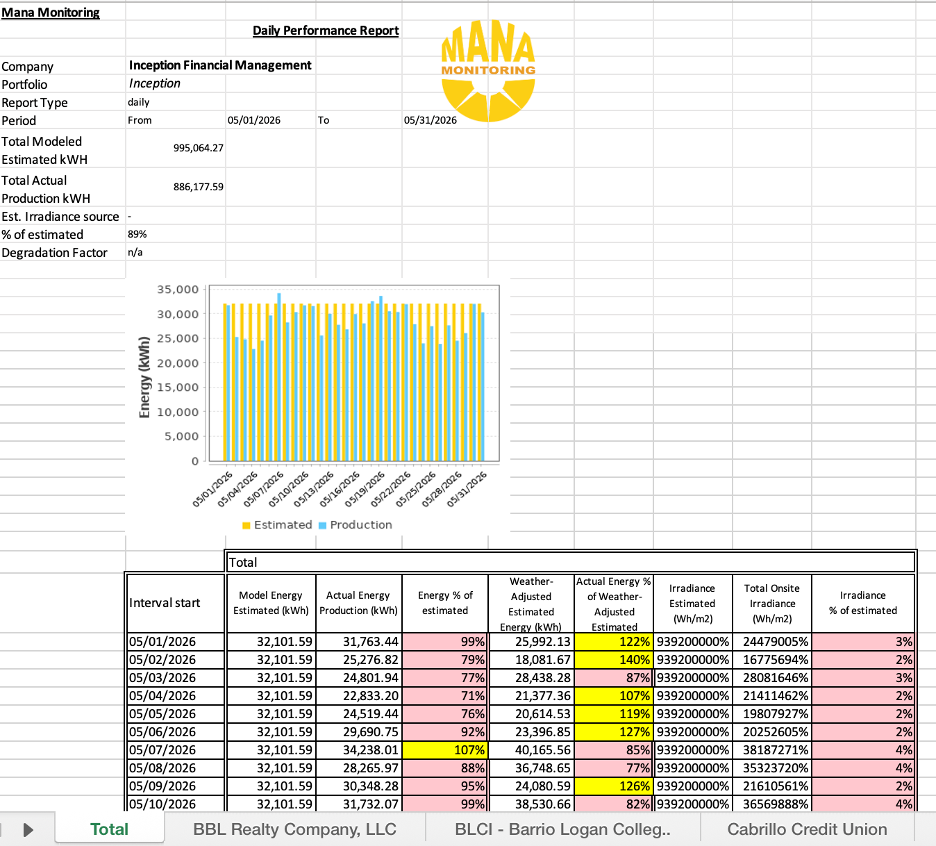
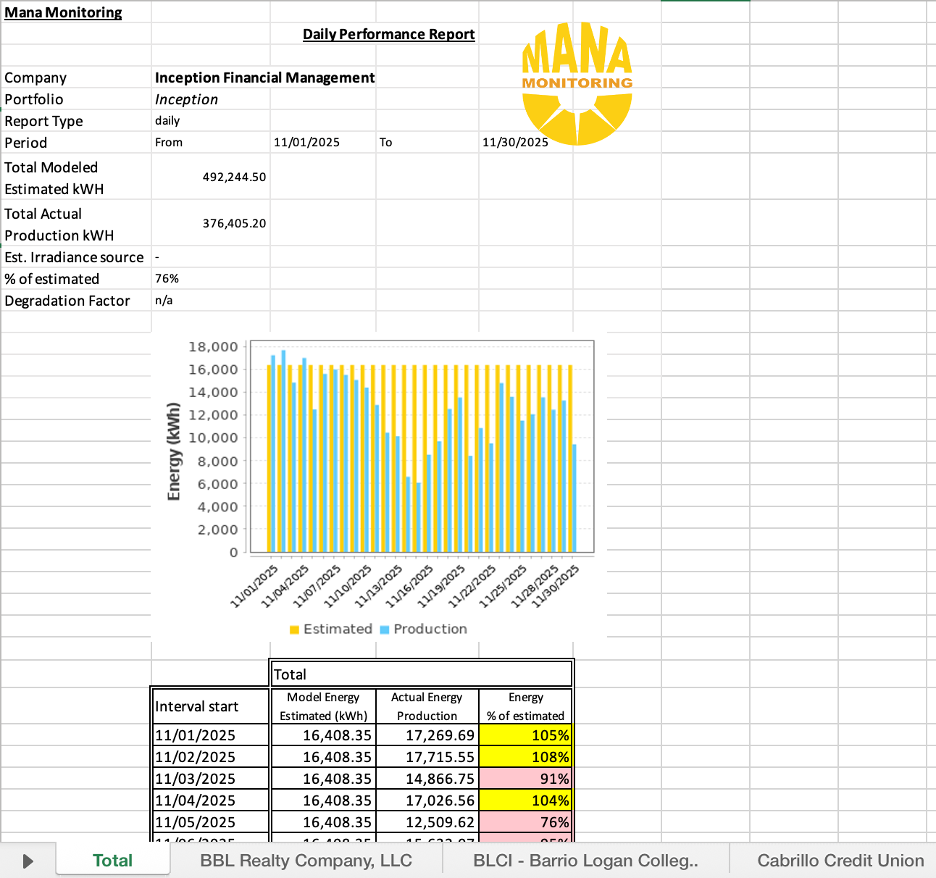
Client Production Report
Master export of all of the client's sites/solar facilities and respective energy production on a daily basis. -
Portfolio Overview Report
Pre-configured portfolio summary and site breakdown showing the actual vs. expected output and irradiance -
Portfolio Issues & Readouts Analysis
Master output of actual output vs estimated and predicted with a summary of open and closed issues/tickets within a user defined period -
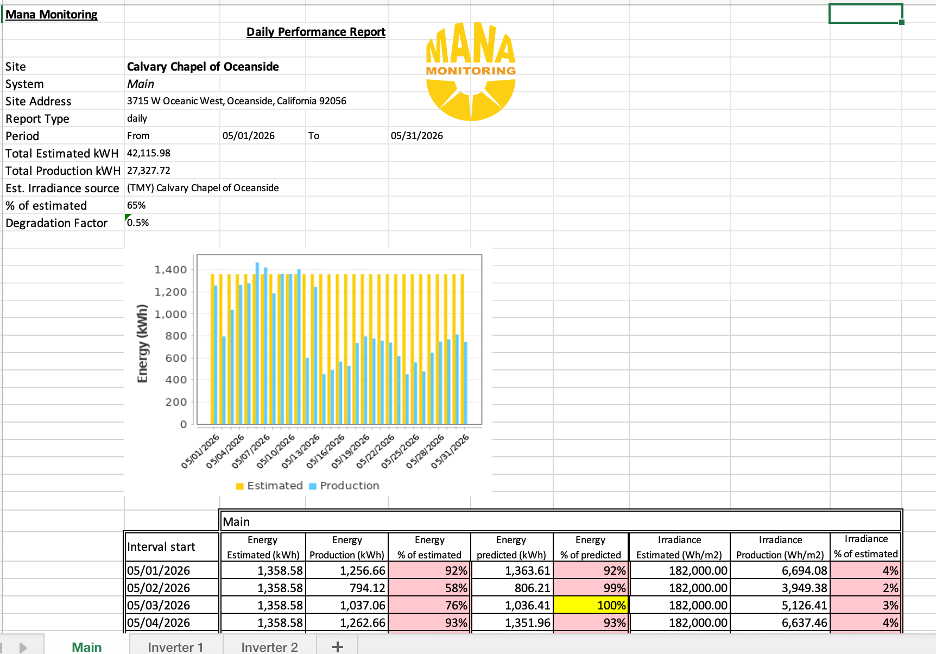
Production Overview
Selected site report showing the actual vs. expected output and irradiance
Device Data
Additionally, you can export the data that Mana acquired from your meter devices in various formats. This is data that is stored on Mana's servers.
- Combined System Readings
- Effective Availability
- Device-level readings:
- Cumulative Energy / Momentary Power
- Cell Temperature
- Irradiance
- Aggregated readings from Virtual Master Meters
- Virtual Irradiance readings
Depending on the type of reading, it is available as raw data, normalized data (meaning it has been transformed to be consistent irrespective of device hw/configuration), hourly aggregated data, daily aggregated data, or monthly aggregated data.
→ Learn how to export device data
Remote Readings
Mana also provides a facility to export data directly from your devices. This is data that is extracted from the devices directly, or from your SCADA software.
→ Learn how to export remote readings
Website Table Data Export
→ Learn how to export table data
You can also export any table you see on the Mana website, for example:
Types of Reports
|
Name |
Type |
Content |
Main data sets |
|
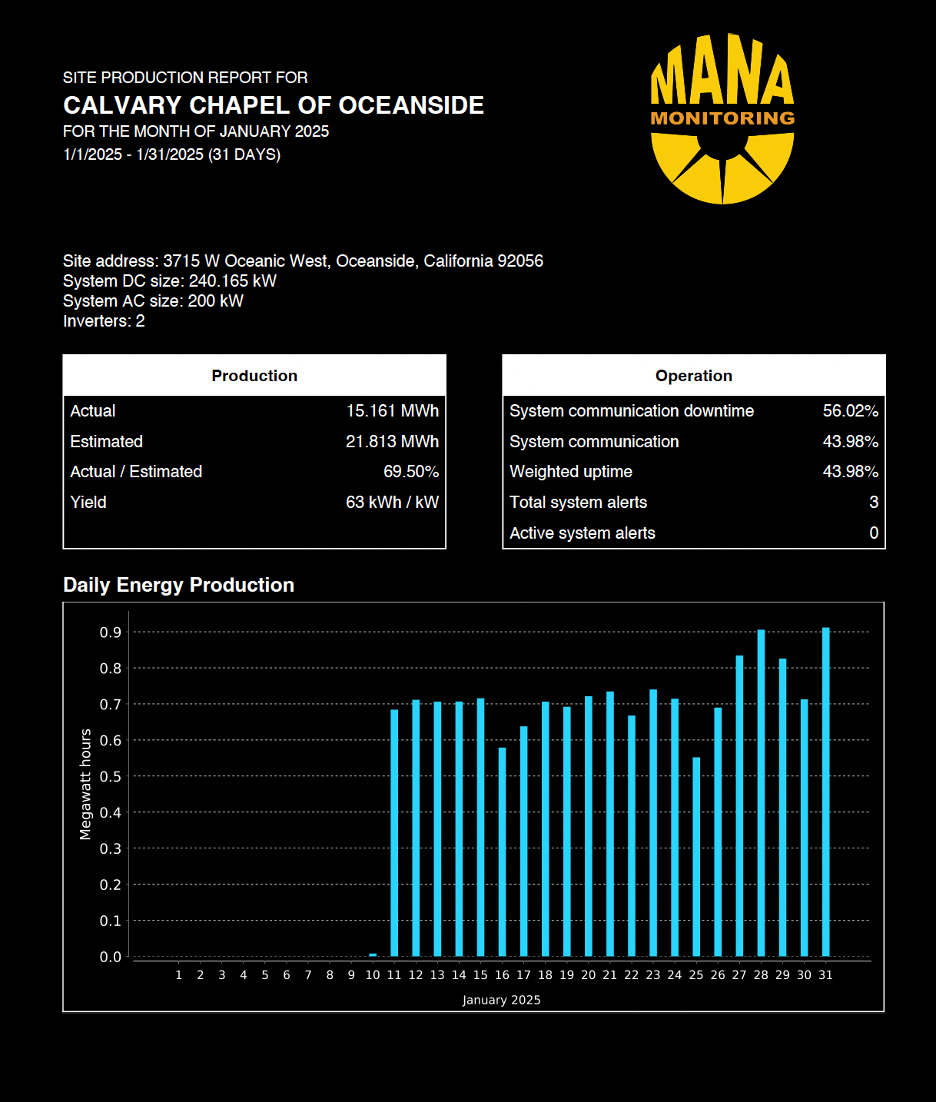
Advanced Site Production Report |
|
A two page report based on AlsoEnergy monthly report that contains monthly production data and operation / alert data:
|
|
|
Client production |
|
Granular report to list daily production, production estimate and predicted information both on site and subsystem / inverter level:
|
|
|
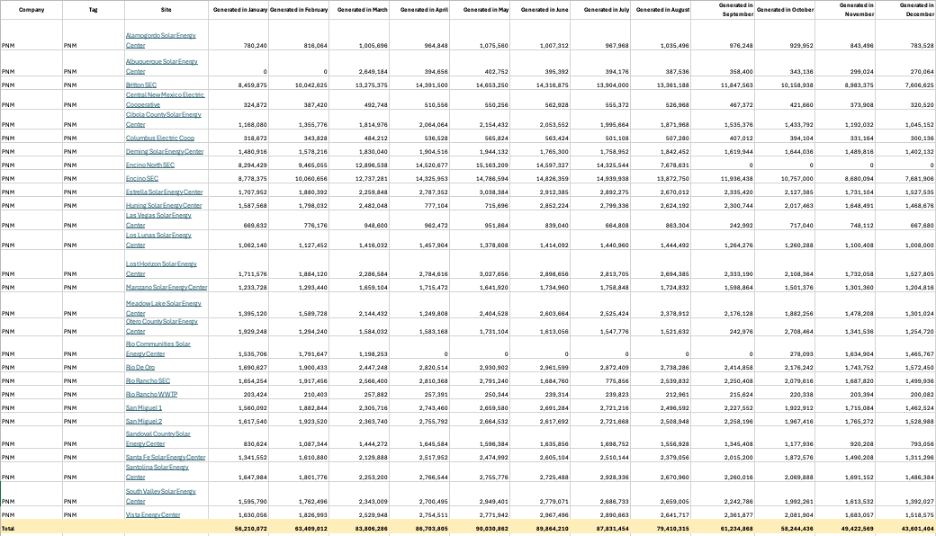
Monthly Portfolio Summary Report |
|
Report lists monthly production figures (kWh) for each site under a certain portfolio |
|
|
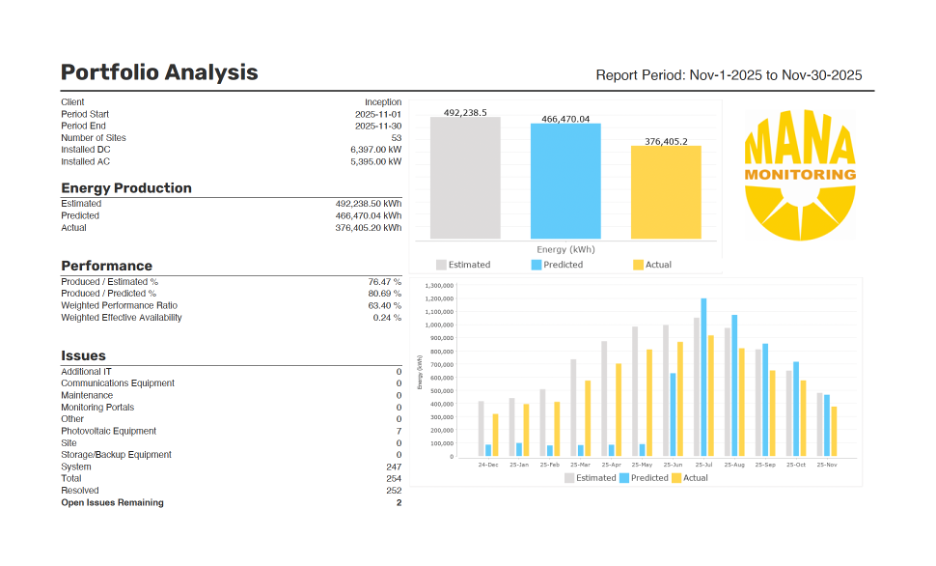
Portfolio Analysis |
|
Report to review the production, performance of the a certain portfolio plus issue analytics:
|
|
|
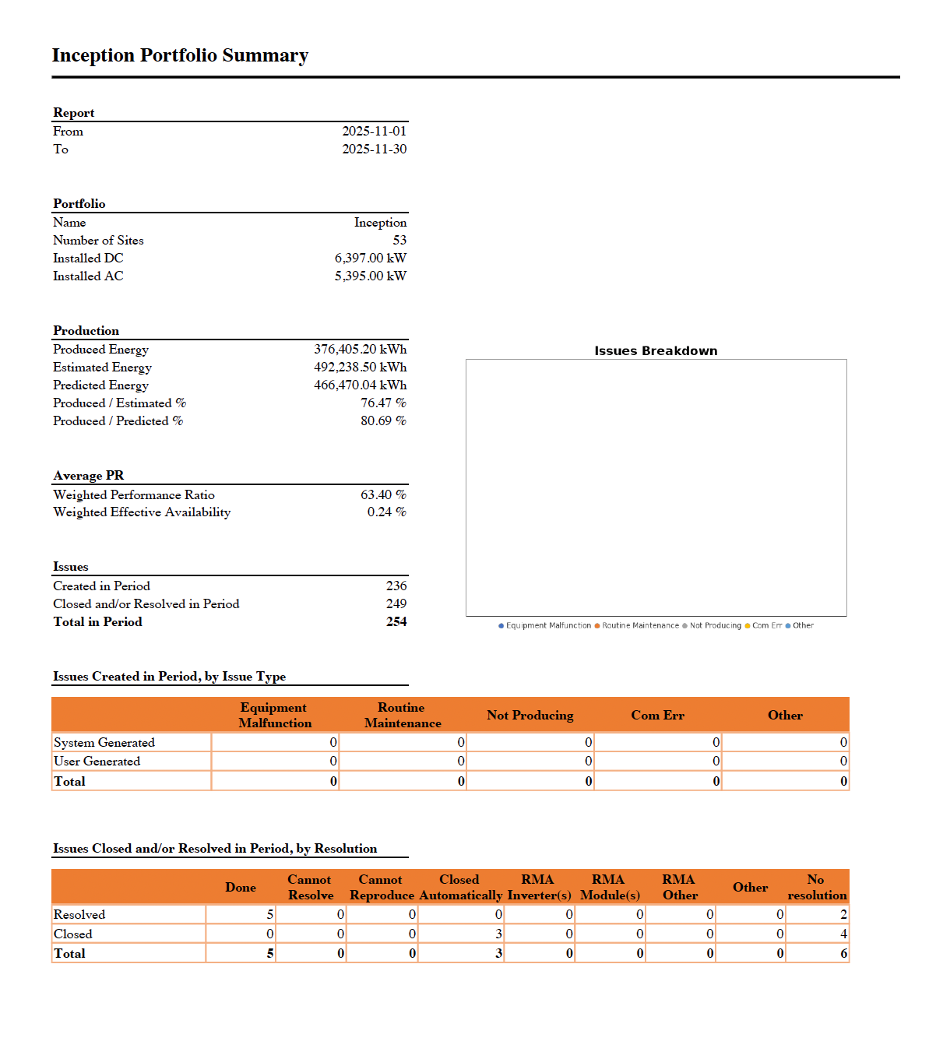
Portfolio Issues & Readouts Analysis |
|
Report with almost the same content as "Portfolio Analysis" extended with issue analytics:
|
|
|
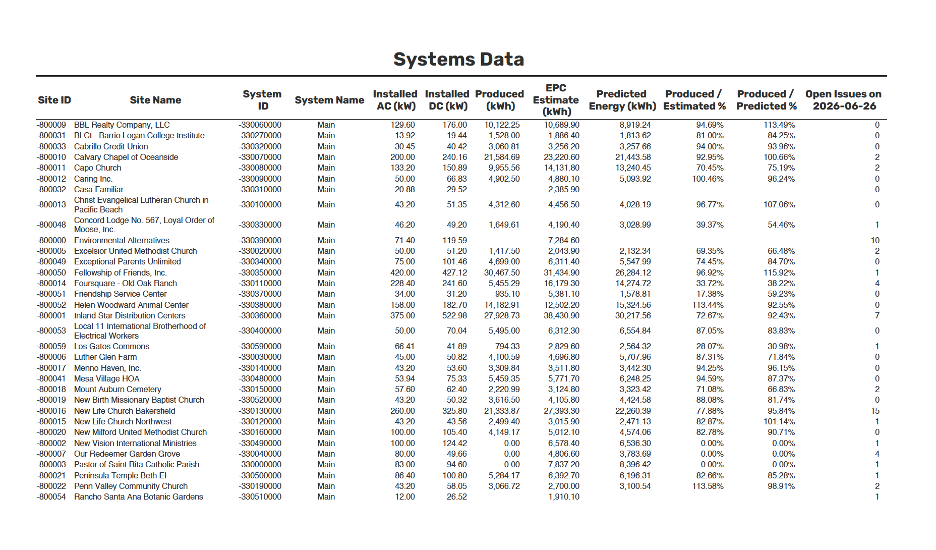
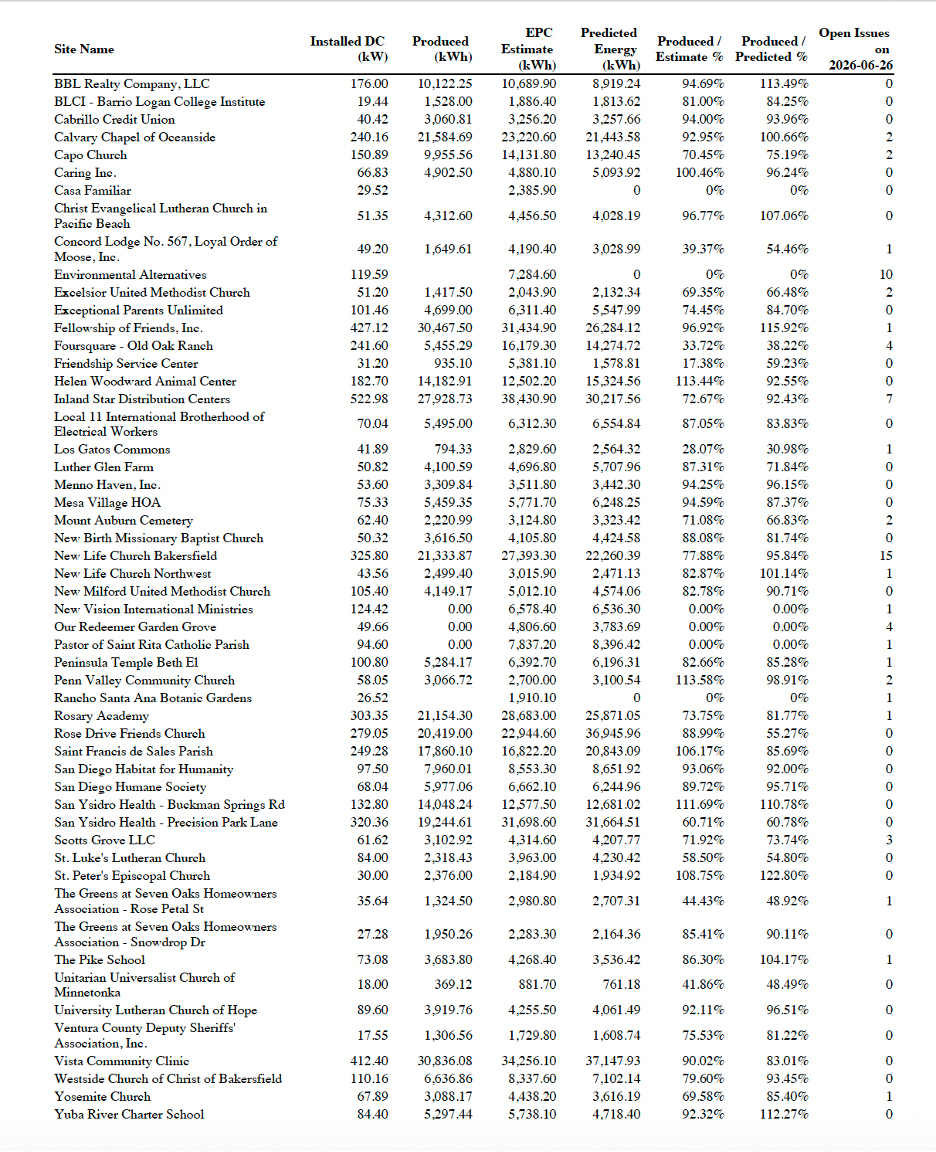
Portfolio Overview |
|
Report with key metrics about the respective portfolio + individual sites on separate sheets:
|
|
|
Portfolio Overview Basic |
|
The very same report as "Portfolio Overview" but without irradiance data |
|
|
Production Overview |
|
The very same report as "Portfolio Overview" that can be generated either for a site or just for a particular subsystem / inverter at the site (depending on last reporting criteria) |
|
|
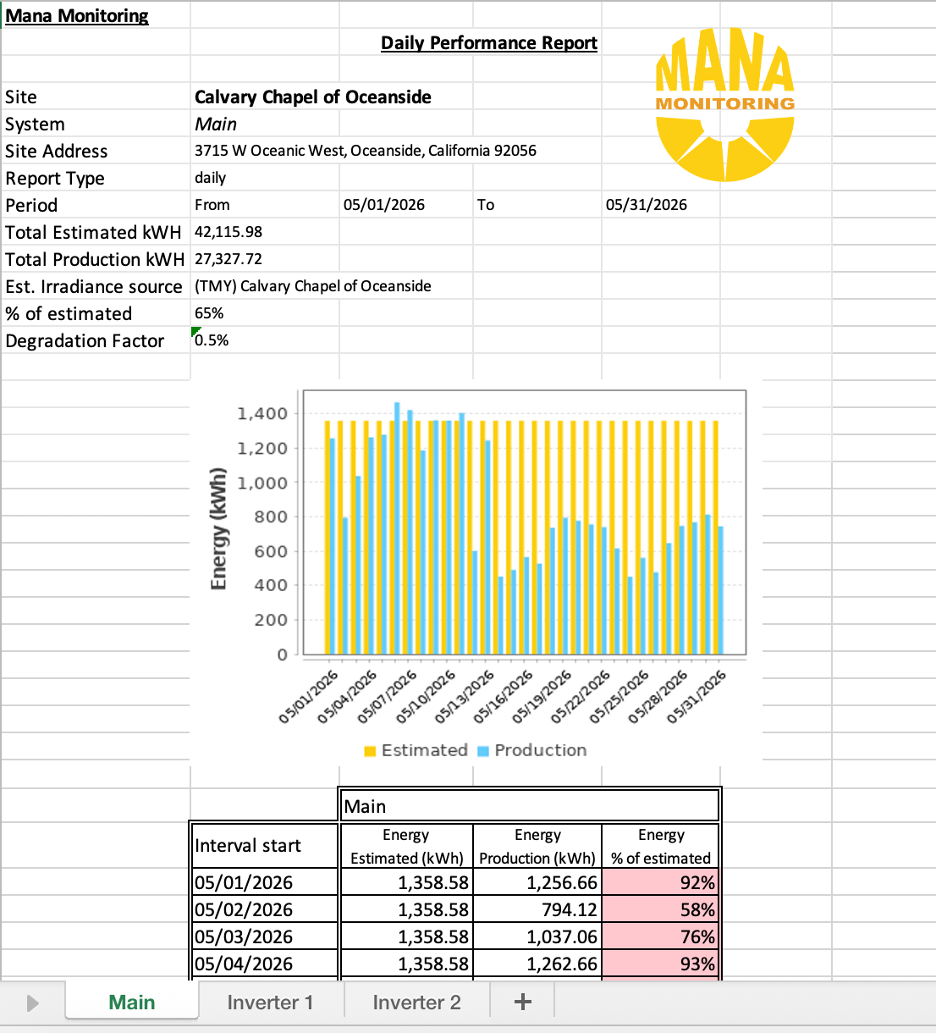
Production Overview Basic |
|
The very same report as "Portfolio Overview Basic" that can be generated either for a site or just for a particular subsystem / inverter at the site (depending on last reporting criteria) |
|
|
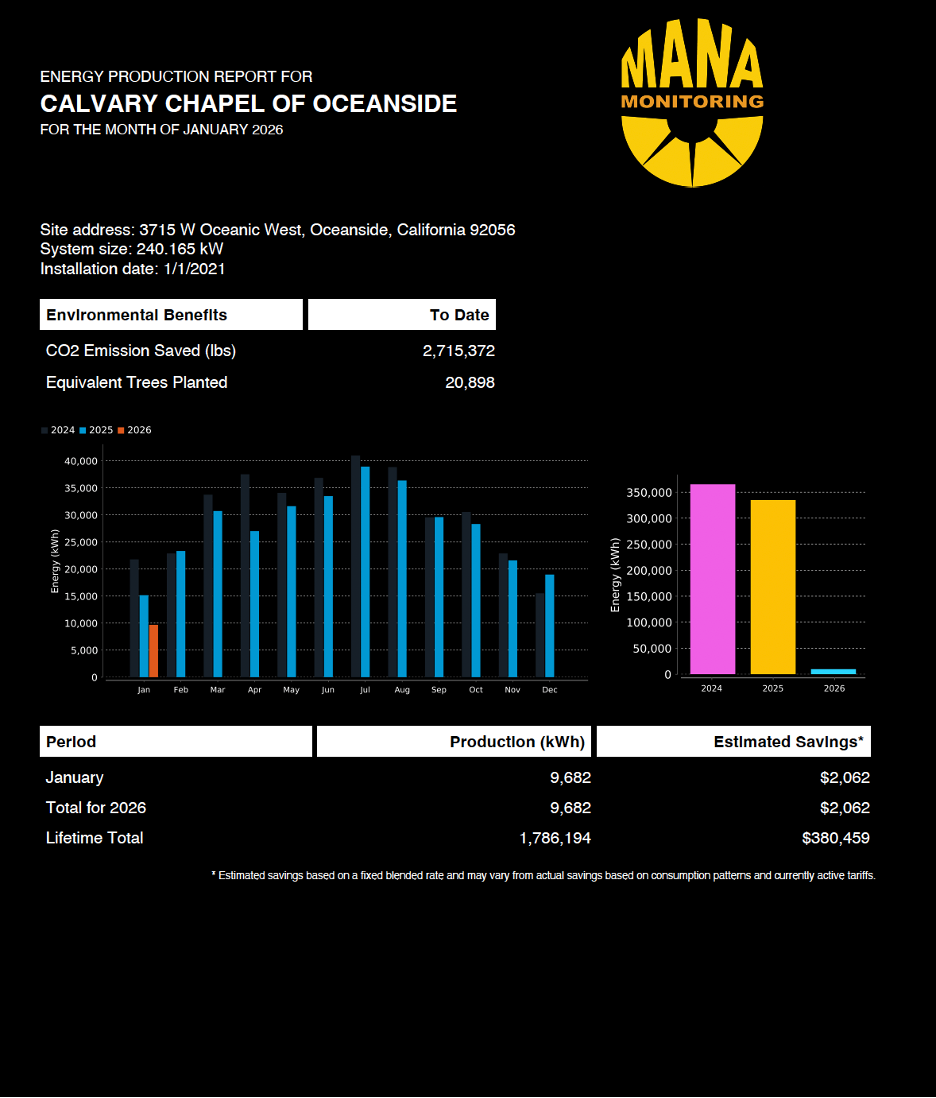
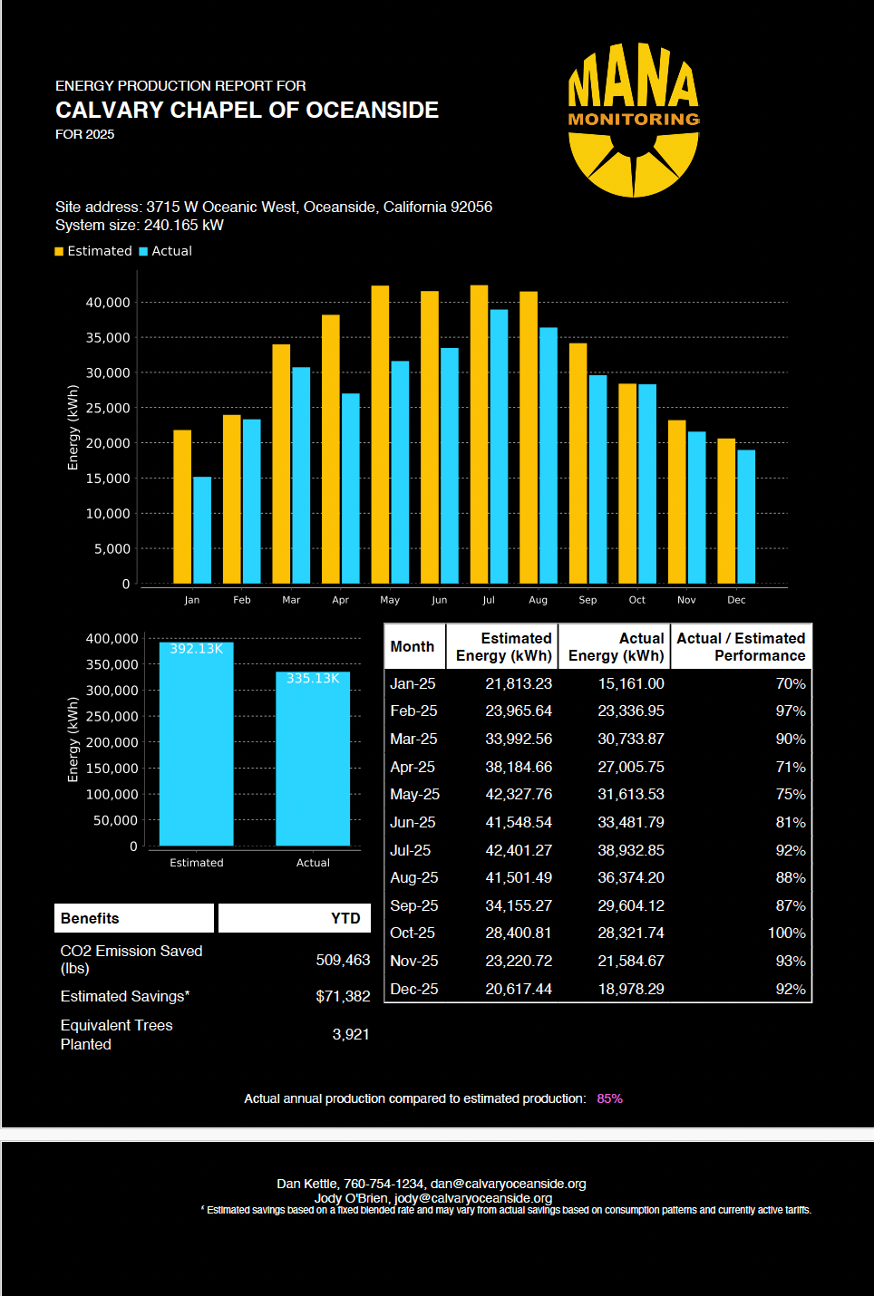
PV report |
|
Summary report for a particular site production in a specific year with 3 years comparison + environmental benefits + estimated savings:
|
|
|
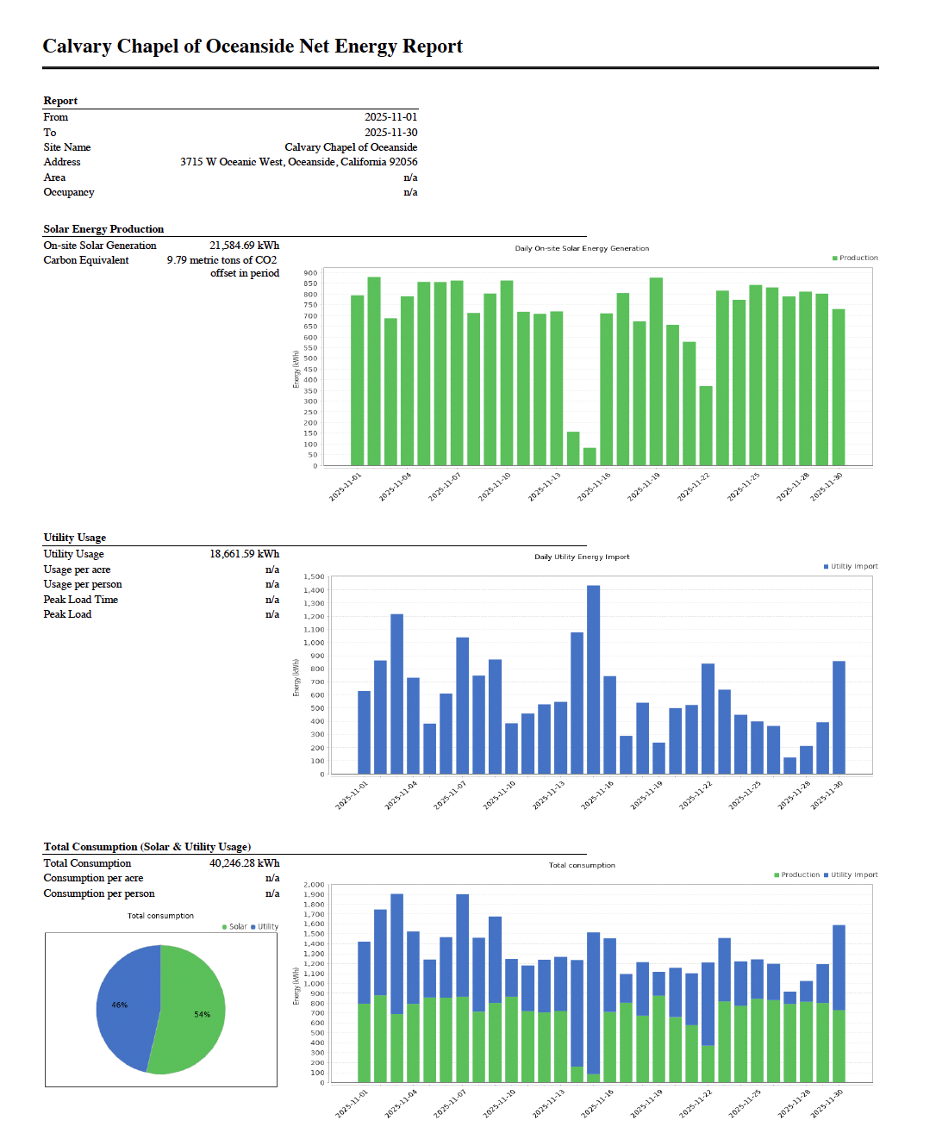
Site Net Energy Report |
|
Report includes a breakdown of :
|
 |
|
True Up Report |
|
True-up report with key information for a specific year:
|
|
|
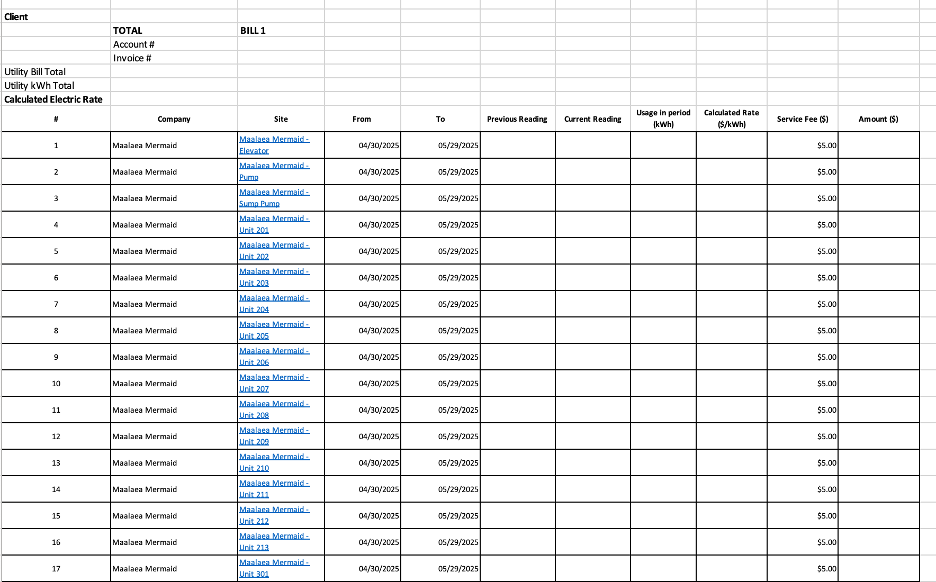
Tenant Utility
|
Format: .xlsx
Granularity: Portfolio
Period: Month |
Breakdown of energy usage during billing period across units. Includes calculated rate and total amount due. |
|
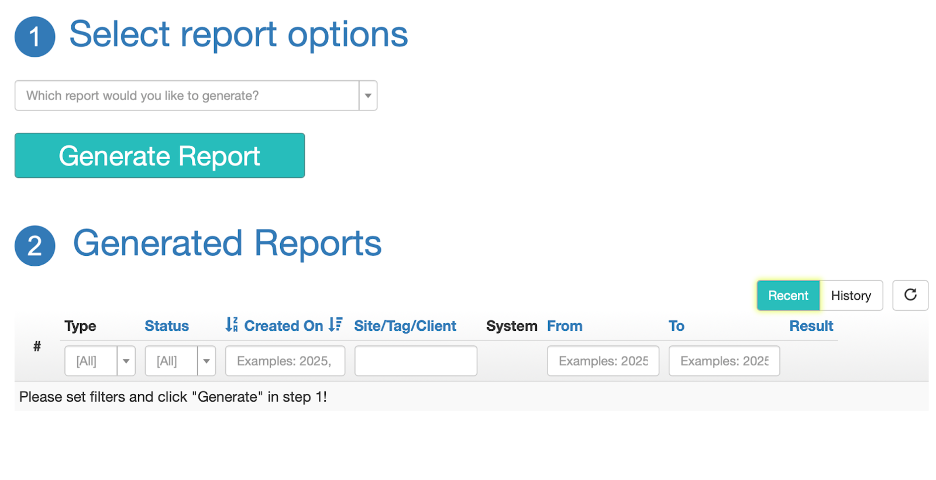
Generating Reports
To generate a report, select the reports tab on the left hand side of the dashboard.

Next, select the filters you wish to generate a report for, including the type of report, the time frame, and the format.
Once you’ve generated your report, it is good practice to reload the data before downloading.
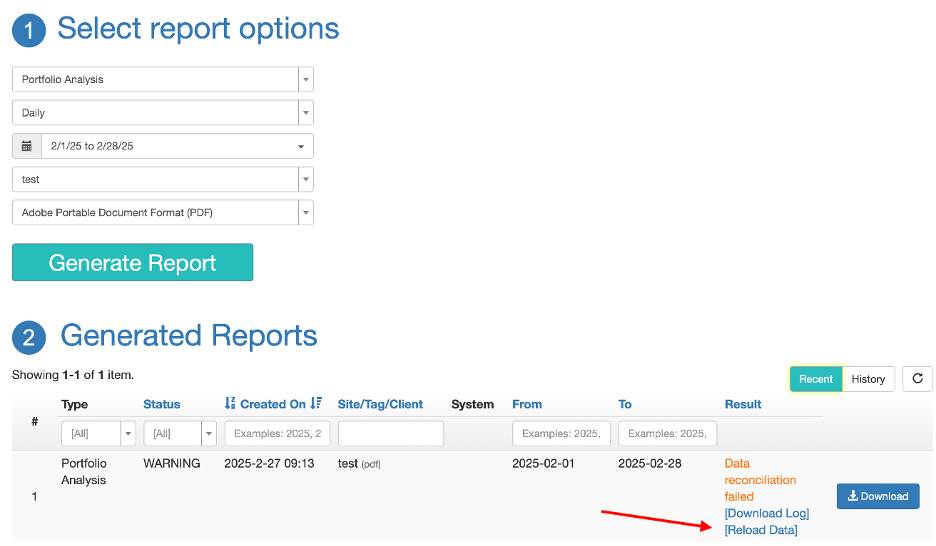
Validate Data in Generated Reports
When you generate a report, the system inspects whether the data in the report has been validated at some point in time. If it finds any indications that the data may not be valid, a warning is displayed and you are given the opportunity to download the reconciliation log and you may also attempt to reload the data:

Hovering over the "Download Log" link you are shown a summary of systems where data may not be valid:

Download the Validation Log
Click on the [Download Log] link to do so.

The report contains the following columns:
- Timestamp: this is the date that the energy readouts refer to
- Sample Time: this is the date that the measurements were extracted from the device - this may correspond to the Timestamp, but it may fall on a later date if the device was offline for a while and the data was only extracted later, or if the data had to be reread from the device due to data validation failures (during a data reload)
- Site ID: the internal ID of the site, you may use this ID when communicating with Mana to identify a site
- Site Name
- System ID: the internal ID of the system
- System Name
- Aggregator? This is "1" for systems that have subsystems, 0 otherwise
- Device ID: the internal ID of the device that supplied the data (this would be the PRIMARY production/consumption device of the system)
- Device Name
- Validation Date: this is the date when Mana validated the data
- Total Energy Output MANA: this is the sum of energy readings that Mana has for that day for that device, this is the value that appears in reports and on various pages on the Mana website
- Total Energy Output Remote: this is the sum of energy readings for that day as returned by the device during validation, it should match the Total Energy Output Mana if validation was successful
- Discrepancy: (Total Energy Output MANA - Total Energy Output Remote) / Total Energy Output MANA
- Explanation
The validation status for a given device/day can be one of the following:
- Data validated successfully: the data was successfully validated on the date shown in the Validation Date column; this does not mean that the data at Mana matches the data on the device in the present
- Date has not been validated yet (because system is offline): the data will be validated once the system comes back online
- Date has not been validated yet (system is reporting 0 production): the data will be validated once the device starts reporting positive values again
- Date has not been validated yet: the data has not been validated yet for an unknown reason
- Date will be validated at end of day: not enough time has elapsed for validation to run
- Reconciliation invalid: local readings have changed: this indicates that the data was validated at some point in time in the past, BUT the local readings have changed since then, therefore it needs to be revalidated; this may come up if the data was manually reloaded from the device
- No production: 0 production was read from the device for the given day, and upon reconciliation the device confirmed that there was no production on that day; this usually implies that Mana is working OK but there is some issue on-site (inverter failure etc.)
- Site has not reported energy (because system is offline): the device has not reported any energy for that day, Mana will backload the data and validate it once the system comes back online
- Site has not reported energy (system is reporting 0 production): the device has been reporting 0 production, the Mana will backload the data and validate it once the system starts reporting positive values again
- Reconciliation failed: this indicates that the data needs to be reloaded (use the [Reload Data] button!)
Note that all information is refreshed when you download the report, so if you download the reconciliation log for a report generated in the past, the validation status will be the status on the day when you download the data, not the status that was known when the report was generated!