Mana User's Manual
- Table of Contents
- Introduction
- Sites Tab
- Devices Tab
- Issues Tab
- Kanban Tab
- Finance Tab
- PPA$ Tab
- Utility Report Tab
- Reports Tab
- FAQs
- How do I identify site issues?
- How do I work with issues assigned to me?
- How do I calculate the carbon equivalent of solar PV production?
- How do I configure notifications?
- How do I calculate effective availability?
- How do I calculate performance ratio?
- How do I export production data?
- How do I add tags to sites?
Table of Contents
Introduction
Sites Tab
Devices Tab
Issues Tab
Kanban Tab
Finance Tab
PPA$ Tab
Utility Report Tab
Reports Tab
FAQs
- How do I identify sites with issues?
- How do I work with issues assigned to me?
- How do I calculate the carbon equivalent of solar PV production?
- How do I configure notifications?
- How do I calculate effective availability?
- How do I calculate performance ratio?
- How do I export production data?
- How do I add tags to a production site?
Introduction
User Guide
I am an asset manager...
Mana can help you with the following:
- Tracking the performance of generation assets based on various metrics e.g. output vs. contractual production forecast, output vs. measured variables (irradiance x dc size)
- Managing subcontractors to ensure peak output and operational up-time (issues/ticketing)
- Coordinating warranty and servicing of equipment
- Billing offtakers and managing PPA contracts
- Providing reporting and metrics to various investors/stakeholders
I work in O&M...
Mana can help you with the following:
- Ensuring facilities and operating by rolling trucks within allotted time period
- Annual O&M visits
- Reporting for system owner(s) and/or offtaker (power user)
- Managing the workflow and prioritizing site visits (Issues/ticketing)
- Ongoing and preventative maintenance (PM)
I am a facility manager...
Mana can help you with the following:
- Tracking energy usage and comparing to baselines
- Billing tenants / power users
Let's take a look how!
Video Tutorial
This video walks you through three common scenarios that Mana Monitoring can help you with as a financial asset manager, O&M company, or facilities manager.
Website Quick Start Guide
The Mana Website, accessible from user.manamonitoring.com, provides access to all of your data stored at Mana along with a plethora of tools and functions to help with your everyday tasks.
Logging In
Open user.manamonitoring.com and enter your credentials:

Make sure to click "Remember Me" if you don't want to have to log into the website every time you access it. Only use this feature on your own computer, not on a public computer.
Note that you need to have a service contract with Mana to access the site, you cannot register yourself.
Introducing the Website

Read the Using the Website chapter to learn about the various pages and functions available to you. Let's take a quick look at some of the features available to you:
(1) Hide the Sidebar
You can hide the sidebar as follows:

You can access it again using the three bars, and pin-it if you wish using the pin button:

(2) Quick-access to Sites and Issues
Use the drop-downs provided at the top of the page to quickly navigate to a specific site or issue:

(3) Recently viewed Sites and Issues
You can also access your recently viewed sites and issues from the sidebar:

(4) Reload the Site
A convenient "Reload" button is available in case you get stuck or wish to start over:

(5) Manage Your Account
You can manage your account by clicking on your name and then "Your Account":

This is also where you can change your password or log out of the site.
Sites Tab
How to Search for Sites
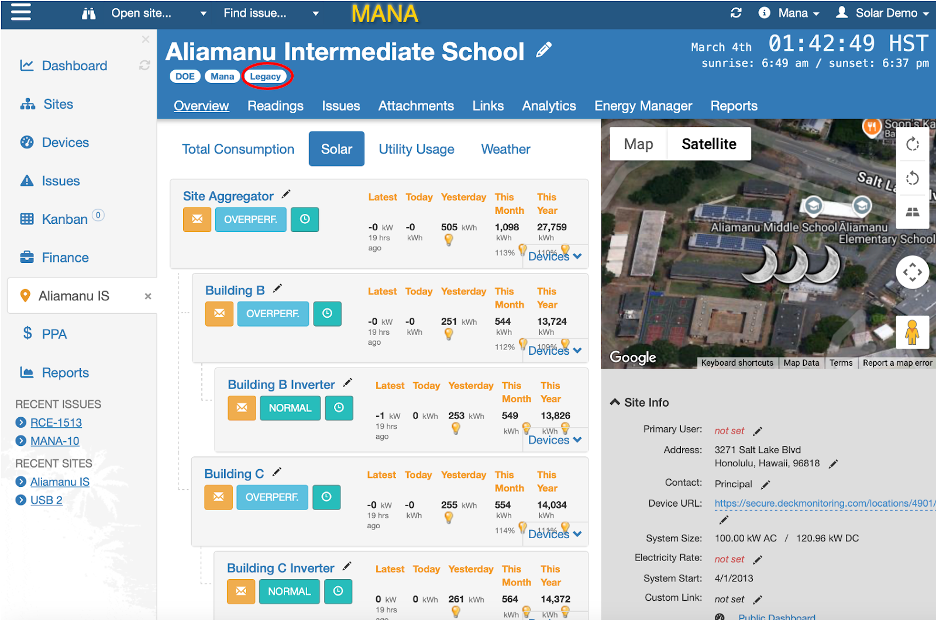
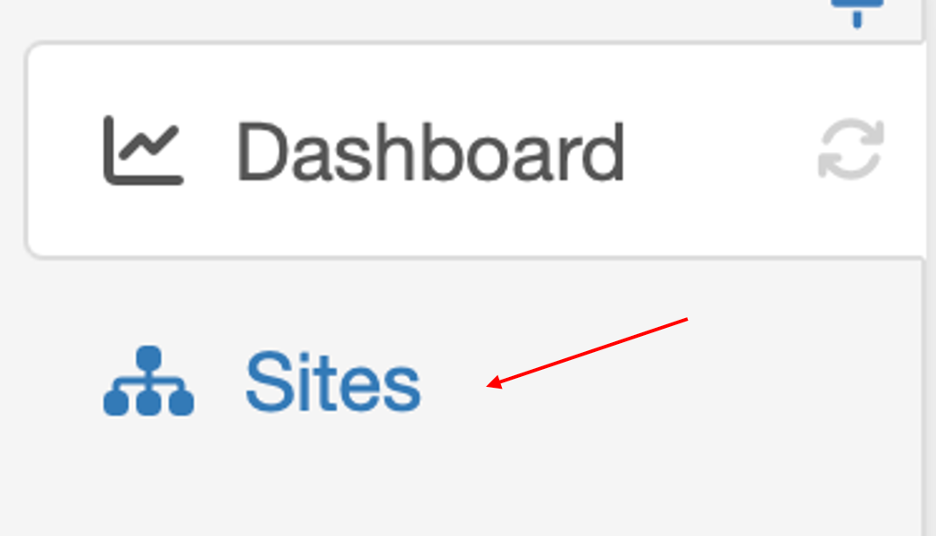
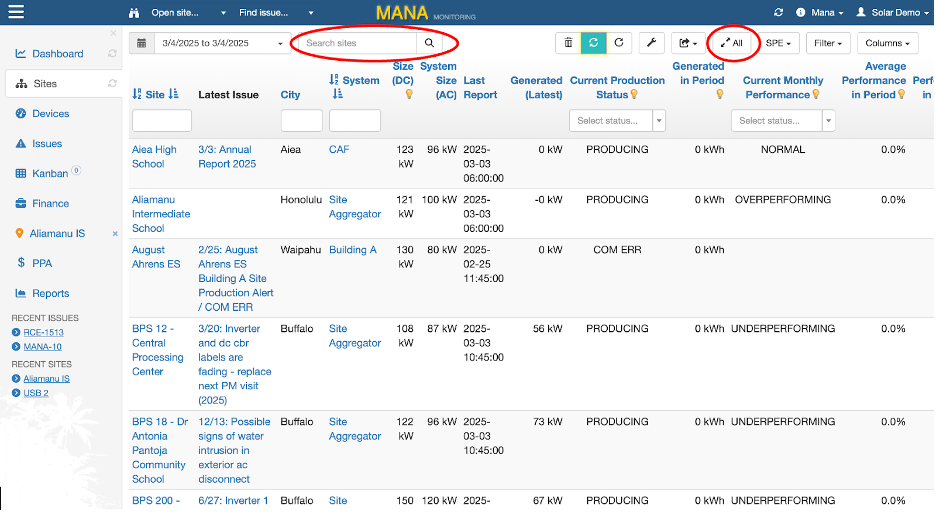
The search function allows you to select the production sites you wish to generate reports for or narrow down the data for a specific site. To search for a site simply select the sites tab at the left hand side of the page.
You can use the sites search box to narrow down the list of sites shown on the Sites page.

The search box enables searching by various criteria:
- site or system name
- company name
- site city or state
- offtaker
- device manufacturer
- site tags
Search by Site or System ID
You can also search for a site or a system by it's unique ID:

Searching + Filtering
You can also combine the "Filter" functionality and the search functionality. For example, to find all schools whose production or consumption devices are offline, set the "Filter" to "Offline" and enter "school" into the search box:

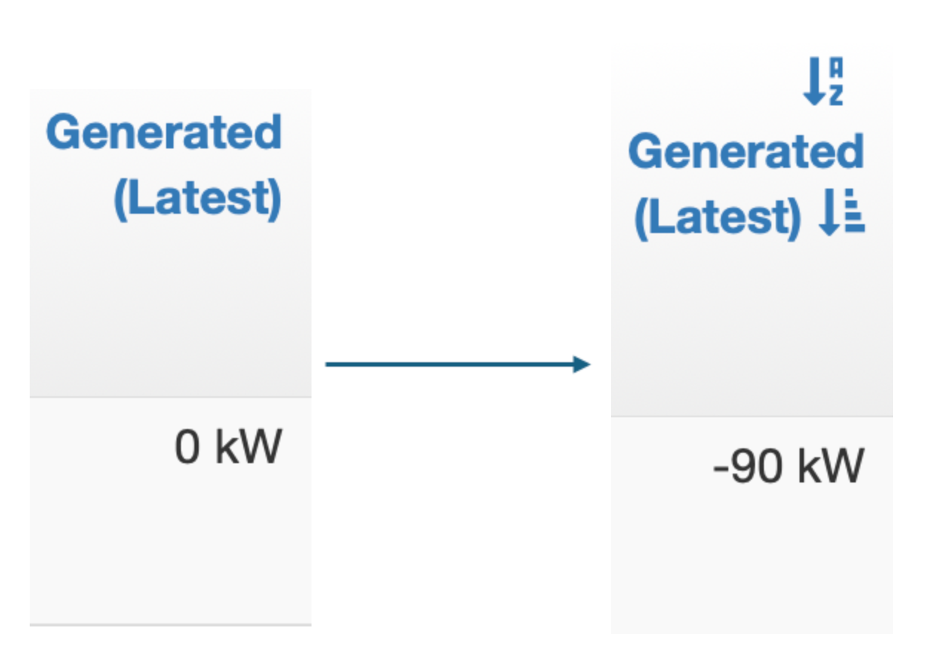
By selecting Generated (Latest) from the task bar, Mana automatically sorts data from least to greatest amount of production generated.
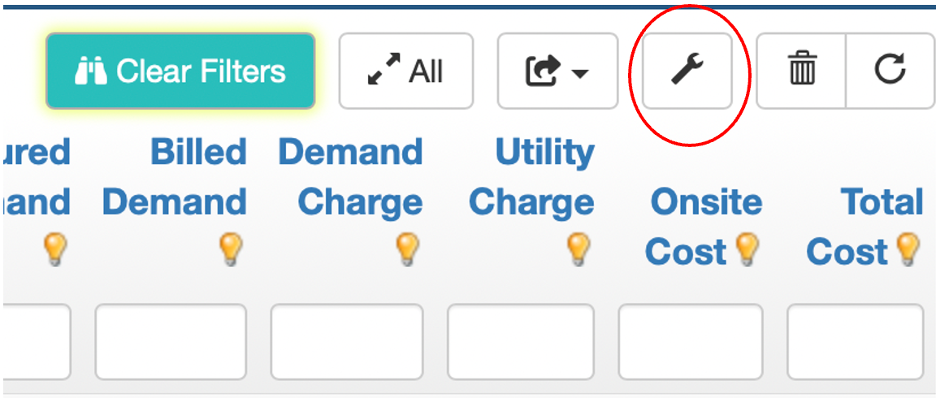
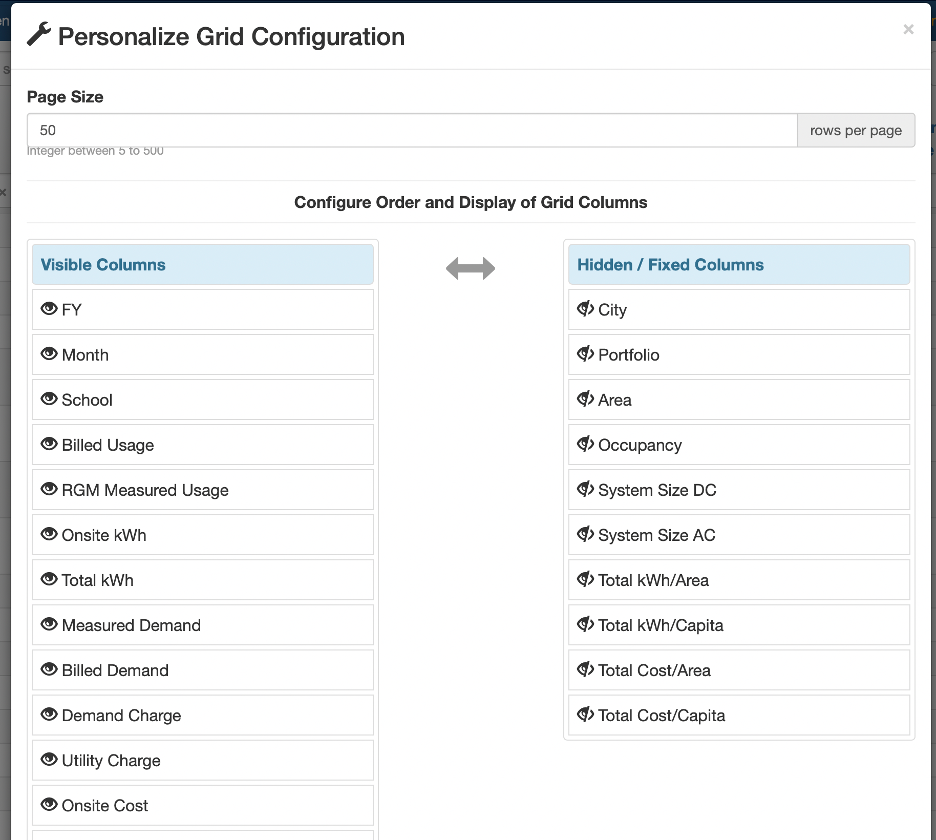
Additionally, the wrench icon allows users to personalize the columns of the site page. Simply select the icon and use drag and drop to configure the most relevant categories. Users can also change the order that they're listed on the screen to group related ones.
Glossary of Icons
The overview map allows you to quickly identify any sites/systems with issues by location. The icon shown for a given site reflects the nature and status of that site.
Production Sites
The icon shown indicates the status of both the aggregator system as well as the subsystems (if there are any).
|
Icon Shown |
Explanation |
Primary System Production Status |
Subsystem Production Status |
|
|
All production meters have reported energy production recently, and it is during daylight hours. |
NORMAL |
NORMAL |
|
|
Some production meters have reported energy production recently, and it is during daylight hours, however, at least one subsystem production meter is experiencing issues. | NORMAL | At least one subsystem status is COM ERR or NOT PRODUCING |
 |
All production meters are experiencing issues (production meters are unreachable or reporting 0 production) and it is during daylight hours. | COM ERR or NOT PRODUCING | COM ERR or NOT PRODUCING |
|
|
It is outside of daylight hours and at least one production meter has reported energy production during the day, however, at least one subsystem production meter is experiencing issues. | NORMAL | At least one subsystem status is COM ERR or NOT PRODUCING |
|
|
It is outside of daylight hours and all production meters have reported energy production during the day. | NORMAL | NORMAL |
|
|
It is outside of daylight hours (and irradiance meters confirm this), but production meters are reporting energy production over 1% of system DC size. | NORMAL | NORMAL |


Consumption Sites
The icon shown indicates the status of both the aggregator system as well as the subsystems (if there are any).
|
Icon Shown |
Explanation |
Primary System Production Status |
Subsystem Production Status |
|
|
All meters have reported energy consumption recently. |
NORMAL |
NORMAL |
|
|
Meters are reporting 0 values, or last reported energy usage was over 12 hours ago. | NORMAL | NORMAL |
|
|
Some meters have reported energy consumption recently, however, at least one subsystem consumption meter is experiencing issues. | NORMAL | At least one subsystem status is COM ERR |
|
|
All consumption meters are unreachable. | COM ERR | COM ERR |


Hybrid Sites
Sites with both production and consumption meters are considered hybrid sites. Such sites have both a production and a consumption status. However, on the map, only the production status determines the icon shown.
System Statuses
Production Sites
A system with a PRIMARY Solar meter is considered a production system. A production system can have one of the following technical statuses:
- COM ERR: Mana has been unable to communicate with the primary production device past a timeout period
- NOT PRODUCING: Mana is receiving readouts from the primary production device, however the device is reporting readings that are too low or zero
- OVERPRODUCING: production to-date this month is over 110% of the estimated production for the elapsed days in this month, derived from the monthly production estimate for the system
- UNDERPRODUCING: production to-date this month is under 90% of the estimated production for the elapsed days in this month, derived from the monthly production estimate for the system
- NORMAL: site is producing normally
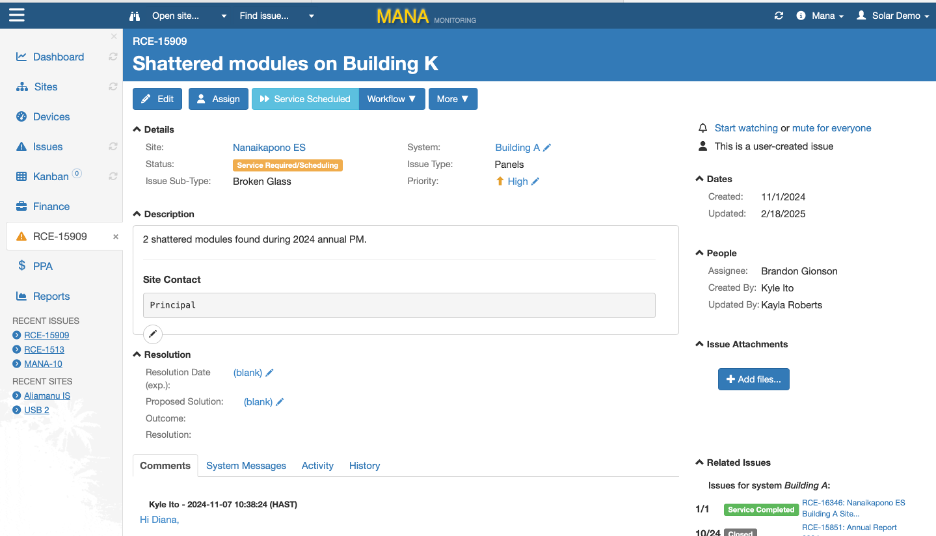
These are the statuses shown on the site details page. An explanation of why a site is assigned a given status can be obtained by hovering the mouse over the status button on the Solar tab:

For usability, the production status is actually shown in two columns on the systems list page.

Select the "Status & Issues" column configuration to show the above columns:

"Production Status" here can be one of:
- PRODUCING (includes sites that are normal, over- or under-performing)
- NOT PRODUCING
- COM ERR
The "Production Performance" column shows whether a site that is producing is actually producing as expected, over- or under-producing.
Automatic Determination of System Status for a System with a Primary Device
The status of a system with a primary production device is determined according to the following rules, shown in order or priority, i.e. whichever rule matches first determines the status. All rules are run against the readings obtained from the primary production meter set for the system. The primary device is indicated by the words (PRIMARY) on the site details page:

Rules
The rules for determining system status diverge depending on whether the system has a timeout set that is under one day (1440 minutes).
Rules for systems where the NOT PRODUCING Notifications Timeout is less than 1 day:
- System has no production device: NORMAL
- Mana has never obtained any readings from the device: COM ERR
- The COM ERR timeout set for the system*1 has passed since the device reported any readings, where the timeout only takes into consideration minutes in the solar day*2 (i.e. if the system did not report during the night, this does not automatically push the system status into COM ERR): COM ERR
- Current power output exceeds the minimum production threshold*3: NORMAL/OVER-/UNDER-PRODUCING (see step #9 below for criteria).
Current power output is determined by taking the most recent reading. If that is 0 or invalid, then we take into consideration the value set in the "0 Power Readout Tolerance" field on the site form. If nothing is set, then we use a tolerance of 60 minutes. This means that if the most recent reading is 0, then we look back in time up to 60 minutes to find the first non-zero value and use that to evaluate if current power output exceeds the minimum production threshold. We allow for this because some sites return 0 as the most recent reading (incorrectly), and also, this is a way to allow a site to not produce power for a few minutes without it affecting the site status.
Power output is determined using direct power readouts if available within the 0 Power Readout Tolerance timeframe. If unavailable, but we can determine positive power during this timeframe from energy readouts (cumulative or delta), then we use that. If that is unavailable, but we have positive direct power readouts from the past 6 hours, then we use that. Otherwise we fall back on the most recent power reading derived from energy readouts (cumulative or delta).
If all readings obtained within the 0 Power Readout Tolerance timeframe are under the minimum production threshold, then this criteria is not met (and we continue evaluating the criteria below).
-
Site time is before the end of the Expected Production Period4 and...
- If performance ratio is unavailable for today or yesterday, and the energy generated today as well as yesterday is less than what the site is expected to produce in a day*5: NOT PRODUCING
- If performance ratio IS available both for today and yesterday, then we compare that to the site Not Producing Threshold Pct*6. In other words, if both the performance ratio for today and yesterday were below the threshold percent, then the site status is: NOT PRODUCING
See MANA-2402 for an explanation as to why this was implemented.
- If performance ratio is unavailable for today or yesterday, and the energy generated today as well as yesterday is less than what the site is expected to produce in a day*5: NOT PRODUCING
-
Site last reported during the Expected Production Period taking into consideration the not producing notification timeout as well as a dawn/dusk offset*7, and irradiance is either set to be disregarded, not available, or available and above the irradiance threshold*8, then: NOT PRODUCING
(note that we already know that the current power output does not exceed the minimum production threshold since we checked for that in step #4)
- Site last reported after the solar day end (minus a dawn/dusk offset*7), and...
- If performance ratio is unavailable for today and the energy generated today is less than what the site is expected to produce in a day*5 then: NOT PRODUCING
- If performance ratio IS available for today, then we compare that to the site Not Producing Threshold Pct*6. In other words, if the performance ratio for today was below the threshold percent, then the site status is: NOT PRODUCING
- If site last status was NOT PRODUCING then we stay with that until production exceeds the threshold (see MANA-2371 to understand why this is required)
- In all other cases:
- If the energy produced so far this month minus the energy produced today is 10% over the predicted energy set for this system for this month, proportionally adjusted to the days elapsed in this month until today: OVERPRODUCING
- Energy produced so far this month minus the energy produced today is 10% under the predicted energy set for this system for this month, proportionally adjusted to the days elapsed in this month until today: UNDERPRODUCING
- Otherwise: NORMAL
Rules for systems where the NOT PRODUCING Notifications Timeout is at least 1 day:
For such systems we use a simplified algorithm for determining system status:
- System has no production device: NORMAL
- Mana has never obtained any readings from the device: COM ERR
- The COM ERR timeout set for the system*1 has passed since the device reported any readings, where the timeout only takes into consideration minutes in the solar day*2 (i.e. if the system did not report during the night, this does not automatically push the system status into COM ERR): COM ERR
- Current power output exceeds the minimum production threshold*3: NORMAL/OVER-/UNDER-PRODUCING (see step #9 below for criteria)
- When the energy generated today is more than what the site is expected to produce in a day*5 then: NORMAL/OVER-/UNDER-PRODUCING (see step #9 below for criteria)
- When the timeout is at least 1440 minutes (1 day)
- and the energy generated yesterday is more than what the site is expected to produce in a day*5 then: NORMAL/OVER-/UNDER-PRODUCING (see step #9 below for criteria)
- or the Site last reported before the solar day end yesterday (minus a dawn/dusk offset*7), and yesterday the site was fine, then don't change the site status (until the morning at least)
(in other words, we will only go to NOT PRODUCING if the site hasn't reported readouts for yesterday by the morning, or if those readouts did arrive but indicated very low energy production.)
- When the timeout is at least 2880 minutes (2 days)
- and the energy generated the day before yesterday is more than what the site is expected to produce in a day*5 then: NORMAL/OVER-/UNDER-PRODUCING (see step #9 below for criteria)
- or the Site last reported before the solar day end the day before yesterday (minus a dawn/dusk offset*7), and yesterday the site was fine, then don't change the site status (until the morning at least)
(in other words, we will only go to NOT PRODUCING if the site hasn't reported readouts for two days ago by the morning, or if those readouts did arrive but indicated very low energy production.)
- When the timeout is at least 4320 minutes (3 days)
- and the energy generated 3 days ago is more than what the site is expected to produce in a day*5 then: NORMAL/OVER-/UNDER-PRODUCING (see step #9 below for criteria)
- or the Site last reported before the solar day end two days ago (minus a dawn/dusk offset*7), and yesterday the site was fine, then don't change the site status (until the morning at least)
(in other words, we will only go to NOT PRODUCING if the site hasn't reported readouts for three days ago by the morning, or if those readouts did arrive but indicated very low energy production.)
- Otherwise: NOT PRODUCING
Footnotes for the above rules
*1: System COM ERR Timeout
The COM ERR timeout set for the system has passed since the device reported any readings...
See System-specific Issue Generation Settings for a more detailed explanation.
This can be set on the system configuration form:

The default value (if not set here) is: 120 minutes.
*2: Business Minutes Elapsed since Last Report
...where the timeout only takes into consideration minutes in the solar day...
When determining how many minutes ago a device last reported, we only take into account the number of minutes elapsed during the solar day, where the solar day can be set on the site settings page:

If not set here, de following default values are used: 7 a.m. - 5 p.m.
Note that for historical reasons we don't make use of the calculated sunrise and sunset values when determining how long a site has not been reporting. Using the calculated sunrise and sunset times here could be argued for.
*3: Minimum Production Threshold
If a site is producing 0, or very little, then we consider it to effectively not be producing at all. This "very little" is determined by the Minimum Production Threshold. This threshold can be set specifically for a site by clicking on the little envelope icon next to the site name:

If not set here, then the threshold is considered to be 1% of the system module output, as set on the system form (System Size field):

If no system size is set, then the threshold is set to 5kW.
*4: Expected Production Period
Site time is before the end of the Expected Production Period and...
We expect a site to produce energy during a period each day. This "Expected Production Period" can be set explicitly for a site on the site details form:
If it is not set here, then we use the calculated site sunrise and sunset times adjusted by a "dawn/dusk offset" value of 60 minutes. See MANA-2402 as to why this was changed from 30 to 60 minutes! 120 minutes. See MANA-3715 as to why this was changed from 60 to 120 minutes!
The sunrise and sunset times for a site are calculated every day based on location / time zone information and using the sunrise/sunset algorithm published by the US Naval Observatory . It is shown on the site detail page in the top-right corner:

In order to "play it safe", a fixed minimum and maximum value is hard-coded. These are: 7 a.m. and 5 p.m.
So, if the sunrise is calculated to be before 6, then the site is expected to be producing after 7. In other words, even if the sunrise is at 4 a.m., it is not expected to be producing before 7 a.m..
Similarly, if the sunset is after 8 p.m., the site is not expected to be producing after 5 p.m..
So, taking the above screenshot as an example, we would expect this given site to be producing between 7:29 am and 5:07 pm on this day.
*5: Site Expected Daily Energy Production:
the energy generated today as well as yesterday is less than what the site is expected to produce in a day...
COALESCE(`system`.ModuleOutput *
(TIMESTAMPDIFF(MINUTE,
site.SiteDayStart,
site.SiteDayEnd
)/60) * COALESCE(site.NotProducingThresholdPct, 0.05), 1)Calculated using the module output (System DC Size on the site configuration form, or AC size if DC is unavailable) multiplied by the site expected production period (see *4 above) and the site "Not Producing Threshold Pct" (see *6 below).
If for some reason any of the above cannot be calculated (system DC/AC size isn't given, or no GPS coordinates are set for the site) then a fix threshold of 1 kWh is used.
*6: "Site Not Producing Threshold Pct"
This if 5% by default, but can be set explicitly for a site on the site settings form:

*7: Site Expected Production Period - NOT PRODUCING Notifications Timeout
Site last reported during the Expected Production Period taking into consideration the not producing notification timeout...
COALESCE(`system`.NotProducingNotificationTimeout, 120) < TIMESTAMPDIFF(MINUTE, site.SiteDayStart, site.SiteDayEnd)
AND DATE(production_device_summary.LastReport) = DATE(`system`.SiteTime)
AND TIME(production_device_summary.LastReport)
BETWEEN (site.SiteDayStart + INTERVAL COALESCE(`system`.NotProducingNotificationTimeout, 120) MINUTE) AND site.SiteDayEndThe site solar day is the same as what is described in footnote #4 above. Additionally, we also allow a leeway that can be set specifically for each system by clicking the envelope icon next to the system name:

So, if the sun rises at 6:29 am at a site and sets at 6:07 pm, and has a NOT PRODUCING Notifications Timeout set to 60 minutes, then we will be checking that the site is producing energy between 8:29 am (6:29 + timeout + dawn/dusk offset) and 5:07 pm (6:07 - dawn/dusk offset). If nothing is set, the default value is 120 minutes.
*8: irradiance is either not available or available and above the irradiance threshold
NOT(site.SystemStatusConsidersIrradiance)
OR device_irradiance_stats.ID IS NULL
OR ABS(TIMESTAMPDIFF(MINUTE, device_irradiance_stats.LastIrradianceReferenceDateTimeUTC, production_device_summary.LastReportUTC)) > 30
OR device_irradiance_stats.LastIrradiance > COALESCE(site.IrradianceThreshold, 50)A site can be set to disregard irradiance completely on the site details page:

If enabled, and the last irradiance data was reported in the past 30 minutes, then we check the last irradiance value reported. If it exceeds the irradiance threshold (50 W/m2 by default, but can be set explicitly for a site on the site details page), then we expect the site to be producing energy during daylight hours as explained above.
Relevant Source Code for System Status Determination
`system`.StatusCode =
CASE
WHEN production_device_summary.SystemID IS NULL
THEN
1 #'NORMAL'
WHEN production_device_summary.LastReportUTC IS NULL
THEN
2 #'COM ERR'
WHEN #MANA-1216 for PV OUTPUT devices take business hours into account only:
production_device_summary.BusinessMinutesSinceLastReport > COALESCE(`system`.ComErrTimeout, 120)
THEN
3 #'COM ERR'
WHEN COALESCE(production_device_summary.CurrentOutput, 0) >= COALESCE(`system`.NotProducingThreshold, `system`.ModuleOutput * 0.01, 5)
THEN
4 #PRODUCING/OVER-UNDER
WHEN /* Current output is below 1% during the solar day (checked previously)
and generated yesterday AND generated today is under threshold
irradiance doesn't matter
*/
TIME(`system`.SiteTime) < site.SiteDayEnd
AND ( system_stats.PerformanceRatioToday IS NULL
OR system_stats.PerformanceRatioYesterday IS NULL)
AND COALESCE(production_device_summary.GeneratedYesterday, 0)
< COALESCE(`system`.ModuleOutput *
(TIMESTAMPDIFF(MINUTE,
site.SiteDayStart,
site.SiteDayEnd
)/60) * COALESCE(site.NotProducingThresholdPct, 0.05), 1)
AND #kWh, MANA-607, MANA-551
COALESCE(production_device_summary.GeneratedToday, 0)
< COALESCE(`system`.ModuleOutput
* TIMESTAMPDIFF(MINUTE,
site.SiteDayStart,
site.SiteDayEnd
)/60 * COALESCE(site.NotProducingThresholdPct, 0.05), 1)
THEN
5 #'NOT PRODUCING'
WHEN /* Current output is below 1% during the solar day (checked previously)
and generated yesterday AND generated today is under threshold
irradiance doesn't matter
*/
TIME(`system`.SiteTime) < site.SiteDayEnd
AND system_stats.PerformanceRatioToday IS NOT NULL
AND system_stats.PerformanceRatioYesterday IS NOT NULL
AND system_stats.PerformanceRatioYesterday < COALESCE(site.NotProducingThresholdPct, 0.05)
AND system_stats.PerformanceRatioToday < COALESCE(site.NotProducingThresholdPct, 0.05)
THEN
55 #'NOT PRODUCING'
WHEN /* Current output is below 1% during the solar day (checked previously)
and last report is today after day start + NotProducingNotificationTimeout and before day end
and irradiance shouldn't be taken into account or irradiance is above threshold (MANA-2402)
*/
COALESCE(`system`.NotProducingNotificationTimeout, 120) < TIMESTAMPDIFF(MINUTE, site.SiteDayStart, site.SiteDayEnd)
AND DATE(production_device_summary.LastReport) = DATE(`system`.SiteTime)
AND TIME(production_device_summary.LastReport)
BETWEEN (site.SiteDayStart + INTERVAL COALESCE(`system`.NotProducingNotificationTimeout, 120) MINUTE) AND site.SiteDayEnd
AND (
NOT(site.SystemStatusConsidersIrradiance)
OR device_irradiance_stats.ID IS NULL
OR ABS(TIMESTAMPDIFF(MINUTE, device_irradiance_stats.LastIrradianceReferenceDateTimeUTC, production_device_summary.LastReportUTC)) > 30
OR device_irradiance_stats.LastIrradiance > COALESCE(site.IrradianceThreshold, 50)
)
# No other check - current output should be at least 1% during the solar day
/* A nice check for above condition:
SELECT EnergyProduced / 3600000,
`system`.ModuleOutput,
CASE WHEN EnergyProduced / 3600000 < COALESCE(`system`.NotProducingThreshold, `system`.ModuleOutput * 0.01, 1) THEN 'X' ELSE NULL END
FROM device_readout_hourly
INNER JOIN device ON device.ID = device_readout_hourly.DeviceID
INNER JOIN `system` ON `system`.ID = device.SystemID
WHERE DATE(ReferenceDateTimeLocal) = '2017-07-21' AND HOUR(ReferenceDateTimeLocal) = 7
*/
THEN
6 #'NOT PRODUCING'
WHEN /* Current output is below 1% during the solar day (checked previously)
and last report is today after day end
and generated today is less than the threshold then NOT PRODUCING */
DATE(production_device_summary.LastReport) = DATE(`system`.SiteTime)
AND TIME(production_device_summary.LastReport) > site.SiteDayEnd
AND system_stats.PerformanceRatioToday IS NULL
AND #kWh, MANA-607, MANA-551, should have produced at least at 10% for each hour since 7 am today
COALESCE(production_device_summary.GeneratedToday, 0)
< COALESCE(`system`.ModuleOutput
* TIMESTAMPDIFF(MINUTE,
site.SiteDayStart,
site.SiteDayEnd
)/60 * COALESCE(site.NotProducingThresholdPct, 0.05), 1)
THEN
7 #'NOT PRODUCING'
WHEN /* Current output is below 1% during the solar day (checked previously)
and last report is today after day end
and generated today is less than the threshold then NOT PRODUCING */
DATE(production_device_summary.LastReport) = DATE(`system`.SiteTime)
AND TIME(production_device_summary.LastReport) > site.SiteDayEnd
AND system_stats.PerformanceRatioToday IS NOT NULL
AND system_stats.PerformanceRatioToday
< COALESCE(site.NotProducingThresholdPct, 0.05)
THEN
77 #'NOT PRODUCING'
WHEN /* MANA-2371: if last status was NOT PRODUCING then we stay with that until production excedes the threshold */
`system`.Status = 'NOT PRODUCING'
THEN
8 #'NOT PRODUCING'
ELSE
9 #PRODUCING/OVER-UNDER
END
Automatic Determination of System Status for a Aggregator Systems
Aggregator systems are systems without a primary physical production metering device, but with subsystems.
The status of these systems is determined based on the status of the subsystems, in the following order of precedence:
- If any of the subsystems have status "NORMAL", then the aggregator system has status "NORMAL"
- If any of the subsystems have status "OVERPRODUCING", then the aggregator system has status "OVERPRODUCING"
- If any of the subsystems have status "UNDERPRODUCING", then the aggregator system has status "UNDERPRODUCING"
- If any of the subsystems have status "NOT PRODUCING", then the aggregator system has status "NOT PRODUCING"
- If any of the subsystems have status "COM ERR", then the aggregator system has status "COM ERR"
Relevant Source Code for Aggregator System Status Determination
CASE MIN(
CASE
WHEN uh.`Status` = 'COM ERR' THEN 4
WHEN uh.`Status` = 'NOT PRODUCING' THEN 3
WHEN uh.`Status` = 'UNDERPERFORMING' THEN 2
WHEN uh.`Status` = 'OVERPERFORMING' THEN 1
WHEN uh.`Status` = 'NORMAL' THEN 0
END
)
WHEN 4 THEN 'COM ERR'
WHEN 3 THEN 'NOT PRODUCING'
WHEN 2 THEN 'UNDERPERFORMING'
WHEN 1 THEN 'OVERPERFORMING'
ELSE 'NORMAL'
END AS `Status`PV Site/System Status Icon
The icon shown in the maps can be one of:

The icon shown is loosely determined by the status of the system based on the following logic (in order of precedence):
- System status is COM ERR/NOT PRODUCING: thunderstorm
- If system has children or grandchildren, and any of the children/grandchildren are COM ERR/NOT PRODUCING:
- and site takes irradiance into account and irradiance is available and above the irradiance threshold (see footnote *8 above) then: sunny+thunderstorm
- and site time is during the expected solar production period (see *4 above) then: sunny+thunderstorm
- otherwise moon+thunderstorm
- Latest power reading was obtained in the past 30 minutes and exceeds the minimum production threshold*3 then: sunny
- Site is set to consider irradiance and the latest irradiance readout was within the past 30 minutes and exceeds the threshold then (see *8 above for more details): sunny
- Site local time is within the Expected Production Period (see *4 above): sunny
- Otherwise: moon
Relevant Source Code
CASE WHEN`system`.`Status` IN ('COM ERR', 'NOT PRODUCING')
THEN
'thunderstorm.png'
WHEN vw_system_l2children.ParentID IS NOT NULL
AND vw_system_l2children.SubSystemsStatus IN ('COM ERR', 'NOT PRODUCING')
THEN
CASE WHEN site.SystemStatusConsidersIrradiance
AND device_irradiance_stats.ID IS NOT NULL
AND ABS(TIMESTAMPDIFF(MINUTE, device_irradiance_stats.LastIrradianceReferenceDateTimeUTC, UTC_TIMESTAMP)) <= 30
AND device_irradiance_stats.LastIrradiance > COALESCE(site.IrradianceThreshold, 50)
AND HOUR(CONVERT_TZ(UTC_TIMESTAMP(), 'UTC', COALESCE(site_time_zone.MysqlName, 'UTC'))) BETWEEN 5 AND 21
THEN
'sunny+thunderstorm.png'
WHEN TIME(CONVERT_TZ(UTC_TIMESTAMP(), 'UTC', COALESCE(site_time_zone.MysqlName, 'UTC')))
BETWEEN COALESCE(NULLIF(site.DayStart, '00:00:00'),
COALESCE(GREATEST(TIME(site.SunriseToday)+INTERVAL _offsetFromDayStartAndEnd MINUTE, CAST('080000' AS TIME)), CAST('080000' AS TIME))
) AND COALESCE(NULLIF(site.DayEnd, '00:00:00'),
COALESCE(LEAST(TIME(site.SunsetToday)-INTERVAL _offsetFromDayStartAndEnd MINUTE, CAST('190000' AS TIME)), CAST('190000' AS TIME))
)
THEN
'sunny+thunderstorm.png'
ELSE
'moon+thunderstorm_v3.png'
END
WHEN vw_system_l1children.ParentID IS NOT NULL
AND vw_system_l1children.SubSystemsStatus IN ('COM ERR', 'NOT PRODUCING')
THEN
CASE WHEN site.SystemStatusConsidersIrradiance
AND device_irradiance_stats.ID IS NOT NULL
AND ABS(TIMESTAMPDIFF(MINUTE, device_irradiance_stats.LastIrradianceReferenceDateTimeUTC, UTC_TIMESTAMP)) <= 30
AND device_irradiance_stats.LastIrradiance > COALESCE(site.IrradianceThreshold, 50)
AND HOUR(CONVERT_TZ(UTC_TIMESTAMP(), 'UTC', COALESCE(site_time_zone.MysqlName, 'UTC'))) BETWEEN 5 AND 21
THEN
'sunny+thunderstorm.png'
WHEN TIME(CONVERT_TZ(UTC_TIMESTAMP(), 'UTC', COALESCE(site_time_zone.MysqlName, 'UTC')))
BETWEEN COALESCE(NULLIF(site.DayStart, '00:00:00'), COALESCE(GREATEST(TIME(site.SunriseToday)+INTERVAL _offsetFromDayStartAndEnd MINUTE, CAST('080000' AS TIME)), CAST('080000' AS TIME)))
AND COALESCE(NULLIF(site.DayEnd, '00:00:00'), COALESCE(LEAST(TIME(site.SunsetToday)-INTERVAL _offsetFromDayStartAndEnd MINUTE, CAST('190000' AS TIME)), CAST('190000' AS TIME)))
THEN
'sunny+thunderstorm.png'
ELSE
'moon+thunderstorm_v3.png'
END
WHEN COALESCE(`system`.CurrentProductionPower, 0) > COALESCE(`system`.NotProducingThreshold, `system`.ModuleOutput * 0.01, 5)
AND ABS(TIMESTAMPDIFF(MINUTE, `system`.LastProductionReport, CONVERT_TZ(UTC_TIMESTAMP(), 'UTC', COALESCE(site_time_zone.MysqlName, 'UTC')))) < 30
THEN
CASE WHEN site.SystemStatusConsidersIrradiance
AND device_irradiance_stats.ID IS NOT NULL
AND ABS(TIMESTAMPDIFF(MINUTE, device_irradiance_stats.LastIrradianceReferenceDateTimeUTC, UTC_TIMESTAMP)) <= 30
AND device_irradiance_stats.LastIrradiance < COALESCE(site.IrradianceThreshold, 50)
AND NOT(TIME(CONVERT_TZ(UTC_TIMESTAMP(), 'UTC', COALESCE(site_time_zone.MysqlName, 'UTC')))
BETWEEN (LEAST(
COALESCE(NULLIF(site.DayStart, '00:00:00'), CAST('120000' AS TIME)),
COALESCE(TIME(site.SunriseToday), CAST('120000' AS TIME)),
CAST('080000' AS TIME)) - INTERVAL _offsetFromDayStartAndEnd MINUTE)
AND (GREATEST(
COALESCE(NULLIF(site.DayEnd, '00:00:00'), CAST('120000' AS TIME)),
COALESCE(TIME(site.SunsetToday), CAST('120000' AS TIME)),
CAST('190000' AS TIME)) + INTERVAL _offsetFromDayStartAndEnd MINUTE)
) # Subtract and add here, unlike in other places, so we make sure not to show the question mark while it's daylight
THEN # Power is being generated and it is nighttime according to irradiance
'sunny.png' # Zoli wants this off: 'sunny+info_circle.png'
ELSE # Power is being generated and it is daytime or no irradiance readouts exist
'sunny.png'
END
WHEN site.SystemStatusConsidersIrradiance
AND device_irradiance_stats.ID IS NOT NULL
AND ABS(TIMESTAMPDIFF(MINUTE, device_irradiance_stats.LastIrradianceReferenceDateTimeUTC, UTC_TIMESTAMP)) <= 30
AND device_irradiance_stats.LastIrradiance > COALESCE(site.IrradianceThreshold, 50)
AND HOUR(CONVERT_TZ(UTC_TIMESTAMP(), 'UTC', COALESCE(site_time_zone.MysqlName, 'UTC'))) BETWEEN 5 AND 21
THEN
'sunny.png'
WHEN TIME(CONVERT_TZ(UTC_TIMESTAMP(), 'UTC', COALESCE(site_time_zone.MysqlName, 'UTC')))
BETWEEN COALESCE(NULLIF(site.DayStart, '00:00:00'), COALESCE(GREATEST(TIME(site.SunriseToday)+INTERVAL _offsetFromDayStartAndEnd MINUTE, CAST('080000' AS TIME)), CAST('080000' AS TIME)))
AND COALESCE(NULLIF(site.DayEnd, '00:00:00'), COALESCE(LEAST(TIME(site.SunsetToday)-INTERVAL _offsetFromDayStartAndEnd MINUTE, CAST('190000' AS TIME)), CAST('190000' AS TIME)))
THEN
'sunny.png'
ELSE
'moon.png'
ENDConsumption Sites
A system with a PRIMARY Total Consumption or Load type device is considered a consumption system. A consumption system can have one of the following technical statuses:
- COM ERR: Mana has been unable to communicate with the primary consumption device past a timeout period
- NORMAL: site consumption is being reported normally
These are the statuses shown on the site details page. An explanation of why a site is assigned a given status can be obtained by hovering the mouse over the status button:

The consumption status is also shown on the systems list page:

"Consumption Status" here can be one of:
- PRODUCING (consumption device is reporting values)
- COM ERR
Automatic Determination of System Status for a System with a Primary Device
The status of a system with a primary consumption device is determined according to the following rules, shown in order or priority, i.e. whichever rule matches first determines the status. All rules are run against the readings obtained from the primary consumption meter set for the system. The primary device is indicated by the words (PRIMARY) on the site details page:

Rules:
- Mana has never obtained any readings from the device: COM ERR
- The COM ERR timeout set for the system has passed since the device reported any readings: COM ERR
- Otherwise: NORMAL
Automatic Determination of System Status for a Aggregator Systems
Aggregator systems are systems without a primary physical production metering device, but with subsystems.
The status of these systems is determined based on the status of the subsystems, in the following order of precedence:
- If any of the subsystems have status "NORMAL", then the aggregator system has status "NORMAL"
- If any of the subsystems have status "COM ERR", then the aggregator system has status "COM ERR"
PV Site/System Status Icon
The icon shown in the maps can be one of:

The icon shown is loosely determined by the status of the system based on the following logic (in order of precedence):
- System status is COM ERR: red triangle
- If system has children or grandchildren, and any of the children/grandchildren are COM ERR: lightbulb + red triangle
- If the device has reported non-zero values in the past twelve hours, then: yellow lightbulb
- Otherwise: white lightbulb
Hybrid Sites
Sites with both production and consumption devices are considered hybrid sites. These sites have both a production and a consumption status in the sites list page. On the map, the status of the production device takes precedence over the status of the consumption device.
The following additional icons are available for use, but not currently in use:

Devices Tab
Overview
The devices tab allows users to view all the devices associated with a given site.
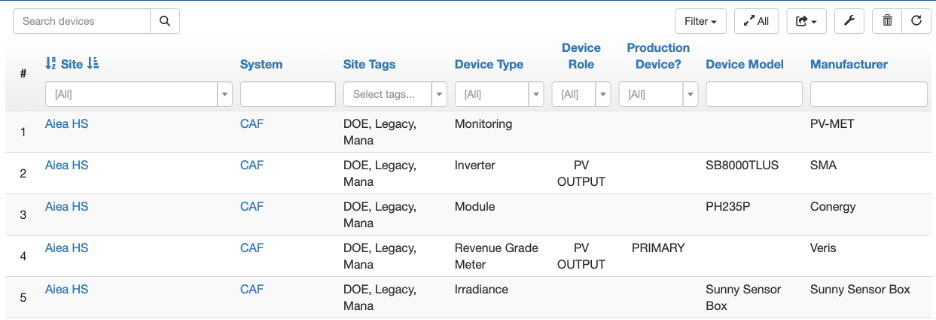
Using the search bar, users can search for specific devices. Under the labels, there are spaces to fill in the blanks where users can filter for several variables, such as the name of the production site, name of system, device type, manufacturer, or device model.
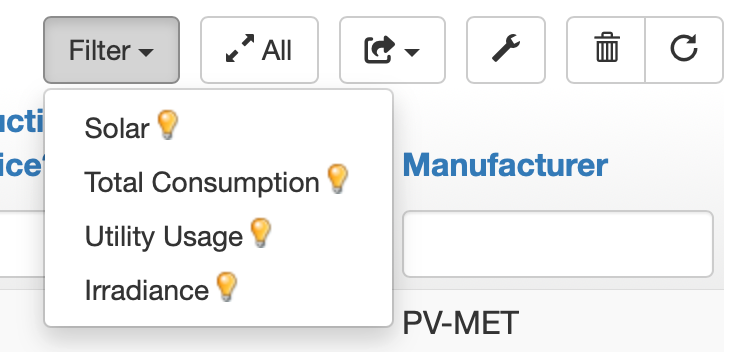
Additionally, the filter function allows users to filter for solar production, total consumption, utility usage, and irradiance.
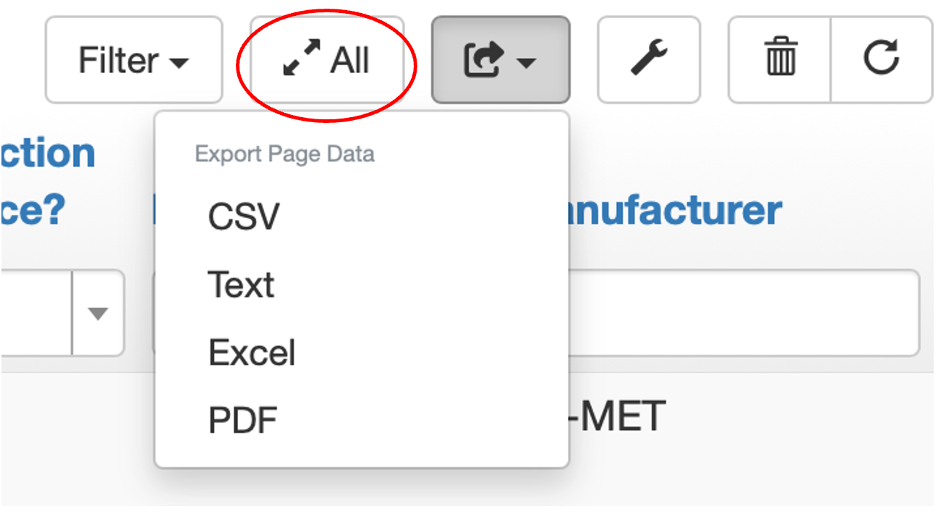
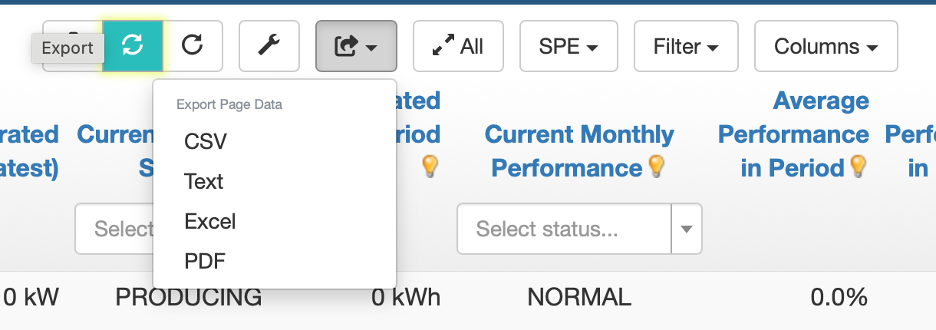
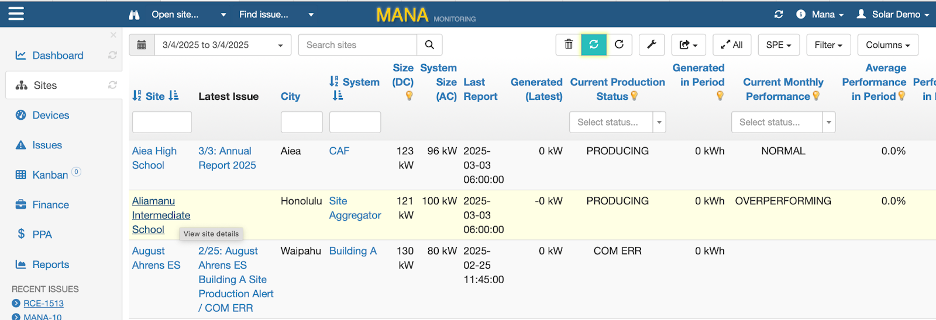
In order to export data, use the export function on the upper right-hand side of the page. If you wish to export data that is listed across multiple pages, make sure to select the all function which will consolidate all available data into a single page.
Additionally, by selecting the site function, you can re-order listings in reverse alphabetical order.
Additionally, the wrench icon allows users to personalize the columns of the site page. Simply select the icon and use drag and drop to configure the most relevant categories. Users can also change the order that they're listed on the screen to group related ones.
Issues Tab
How to Search for Issues
You can use the issue search box to narrow down the list of issues shown.

The search box enables searching by various criteria:
- issue code, summary, description, resolution
- latest issue comment
- site name, site city or state
- site tag(s)
- company name
Search by Issue Code
If you wish to search for issue by #, then you have to include the complete issue ID. For example: RCE-2259

This is necessary because if we allowed partial matches in the Issue # field, then searching for "100" would bring up all issues that have "100" in the Issue # (or any of the other fields). So, RCE-100 would match, but so would RCE-1000 and RCE-1001 etc.
Searching for Closed Issues
Whether the search results contain closed issues or not is determined by the filter applied to the view. So, if you wish to find closed issues, then either set the filter to "Closed Issues" or "All Issues":

Issue Search and "Threaded View"
Note that previously another factor that could influence whether you find an issue or not is the "Threaded View" filter. When this is clicked, only the latest issue for each site is shown. So if you searched for RCE-2258 and "Threaded View" was on, then it wouldn't find it because there is a newer issue for Kauluwela already (RCE-2260). Because this can get confusing, we've modified the site to disable "Threaded View" when using the search box. So if you search for "Kauluwela" and have the filter set to "All Issues" then you should see all issues for "Kauluwela."
Filter + Search
In addition to issue code and site name, you can also use the search box to search for issues by summary, description, resolution, the latest issue comment, city, state, tag, or company name. So, for example, if you wish to see all open issues for all sites in Honolulu, you should set the "filter" to "Open Issues" and search for "Honolulu":

Configure Screen
Additionally, the wrench icon allows users to personalize the columns of the site page. Simply select the icon and use drag and drop to configure the most relevant categories. Users can also change the order that they're listed on the screen to group related ones.
Issue Workflows
Issue Workflows
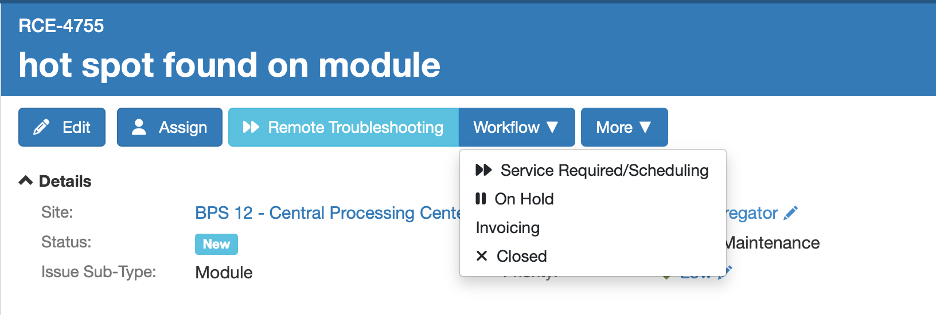
An issue can follow one of two workflows:
- The "Default" workflow is quite simple and includes the following statuses:

- The "Servicing" workflow is better suited for issues that require a site visit or more involved troubleshooting:

Moving an Issue Between Workflows
An issue can be moved from one workflow to another both on the issue page or on the issues list page.
On the issues page, you can change the workflow using the "Change Workflow" function:


Bulk-moving Issues Between Workflows
If you need to move multiple issues at a time:
- Open the Issues List page
- If the "Workflow" column is not in your view, click on the wrench icon and, in the window that appears, drag it from the column list on the right to the column list on the left, and click save to add it to your view
- Then use the checkboxes on the right to select the issues you wish to move (or click on the top-right corner to select all issues in view)
- And finally use the "Change Workflow" button at the top of the screen to bulk move all selected issues to the new workflow.
Visual guide follows.
Adding "Workflow" column to your issues list view:


Selecting all issues:

Changing workflows:


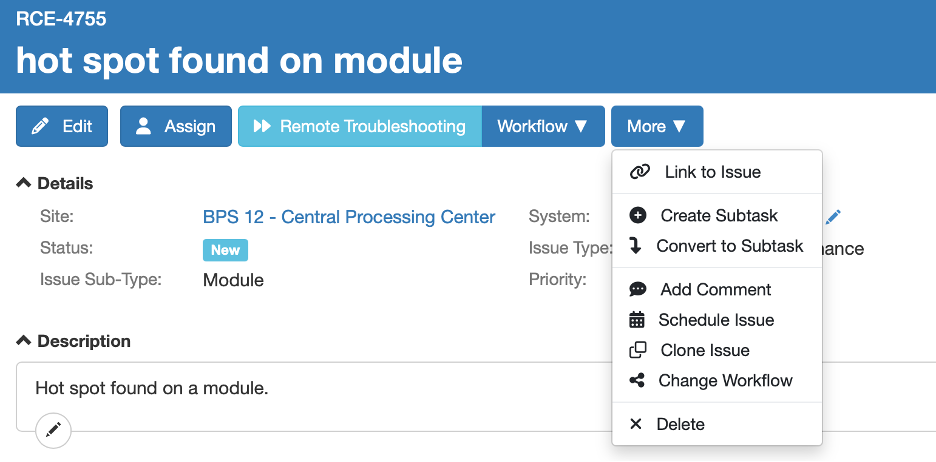
Link Issues
Issues can be linked together by using the "Link to Issue" function available on the single issue page:

Select how the two issues are related:

as well as the related issue, and click "Link Issues":

Only issues that belong to the same client can be linked. Issues that are "closed" or deleted are not shown in the list of options.
Afterward the linked issue will be shown in the "Linked Issues" section, including the current status of the linked issue:

You can click on the issue to navigate to it.
The link is also displayed after opening the linked issue, thus it is easy to navigate between linked issues:

To break an issue link, click the little broken chain icon next to it:

Issues shown in the "Related Issues" section are not linked, they are just issues that have been created for the same site or system:

Sub-tasks
Sub-tasks can be created either by creating a sub-task for an existing issue, or converting an issue into a sub-task by selecting the parent issue.
Create a Sub-task
Use the "Create Subtask" link from the single issue page to create a sub-task for an issue:

The sub-task issue will initially be set to belong to the same site as the parent issue, but this can be changed if needed by editing the issue after it is created. The System, Issue Type, Issue Sub-Type, and Priority fields are copied from the parent issue, but can be changed before saving the new issue. It is also possible to add a comment to the new issue when it is created:

Navigation Between Issues and Sub-tasks
Sub-tasks that have been created for an issue can be seen on the issue page:

On a sub-task page, you can see and navigate to the parent issue at the top of the page:

Convert an Issue into a Sub-task
An existing issue can be converted into a sub-task by using the "Change Parent" function:

Select the parent task and click "Save":

Scheduling an Issue
An issue can be scheduled using the "Schedule Issue" function on the single issue page:

Set the deadline and click Schedule:

The issue deadline can be seen in the right column on the issue page:

Cloning an Issue
A copy of an issue can be created using the "Clone Issue" function:

Most issue properties are copied from the cloned issue:

After the issue is cloned, the newly created issue is automatically opened.
Kanban Tab
Overview
The Kanban tab allows users to monitor site issues as they progress from the initial report to completion.
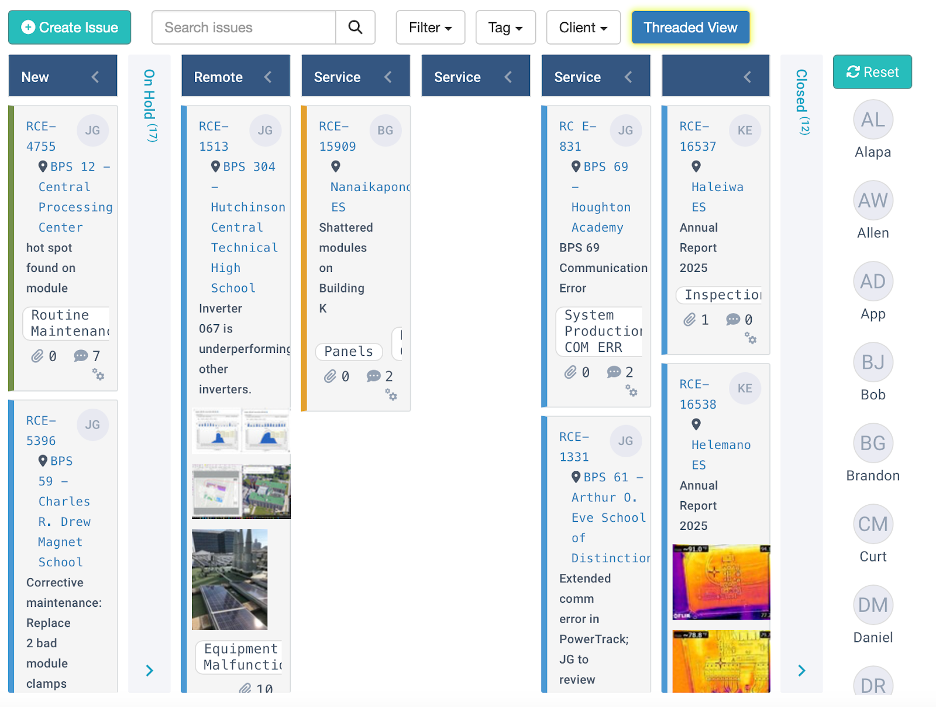
Tickets are organized by priority, with more relevant ones located higher on the page. This helps serves the majority of customers in two ways:
Scenario 1 - Financial asset managers working with one or several O&M companies have weekly status meetings and go through open issues. Their goal is to maximize profits and fix issues in order to reduce potential loss. Mana can help them identify which issues to prioritize via Kanban and designate what the O&M company should do.
Scenario 2 - O&M companies using Mana work for several financial asset managers. They can similarly use this feature to help plan the schedule of resolving issues from greatest to least priority.
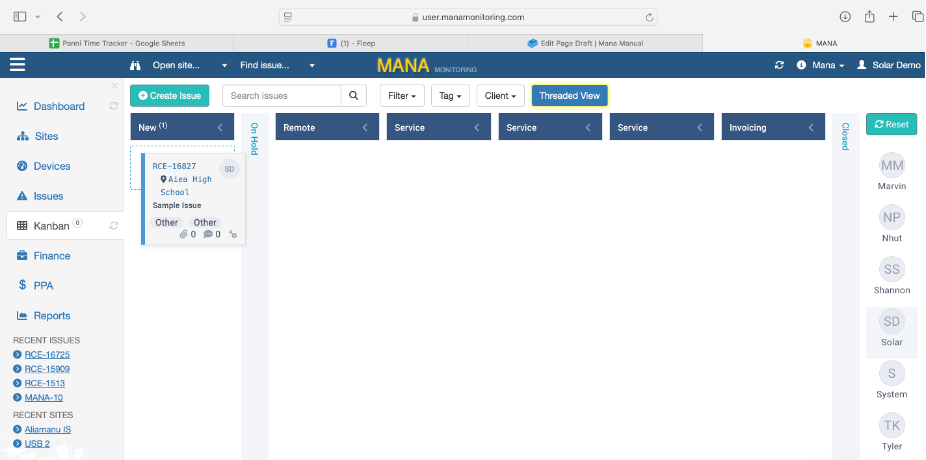
The search bar allows users to filter down the issues for a specific client or site tag.
The left-hand column shows newly generated tickets by users, or those automatically reported by Mana. There are two main workflows for how a ticket can move from registration to closure.
On the right, different statuses are represented. The goal is to fix issues remotely. However, if O&M is unsuccessful, then a service is requested and an engineer visits the site.
When the service is completed, an invoice is generated.
The right hand tab shows tickets that are closed.
Tickets can be moved forward using drag and drop.
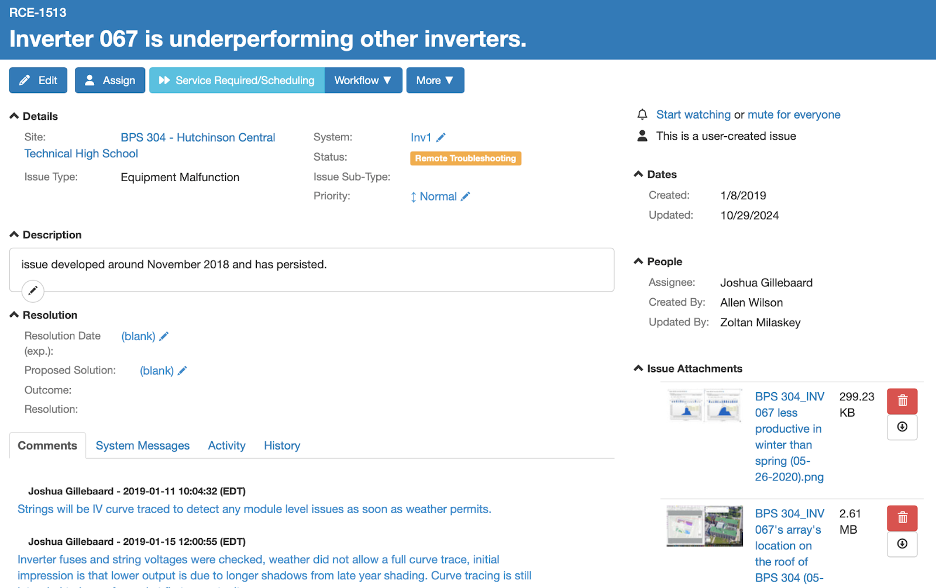
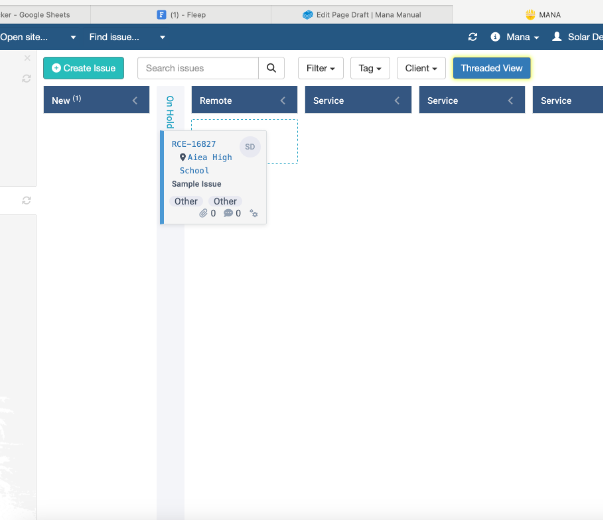
Key information can be viewed by clicking on the ticket.
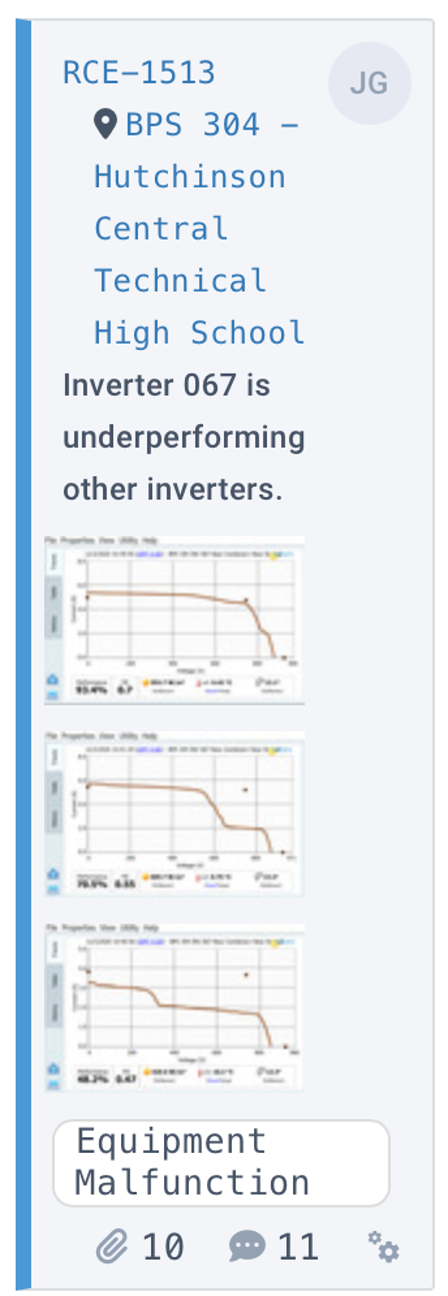
The assignee is designated in the top right-hand corner of the ticket. Tickets can also contain comments and attachments, such as photo uploads, which can reveal important information about the issue at hand.
Via the Kanban tab, it is possible to create schedules for resolving tasks or adding subtasks and maintain them virtually.
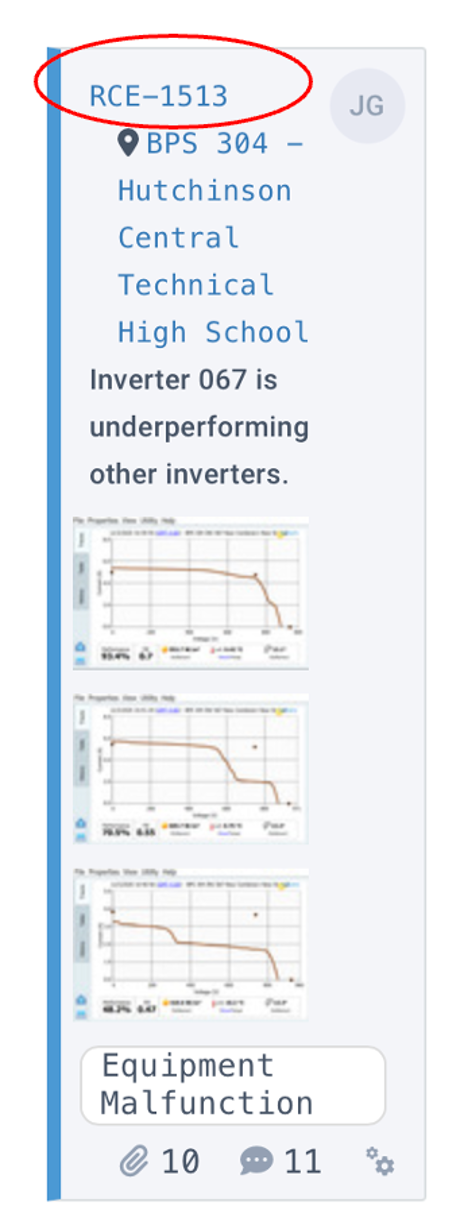
Selecting the reference number of a ticket transfers the user to a general information page, where more detailed information is available about the process of resolving the issue, such as task history and chats between clients.

Ticket Workflow
Tickets in Kanban workflow move left to right as tickets are opened and progress to completion.
Double clicking on a ticket allows users to view the issue and make edits. In this window, users can add information about the issue such as level of priority and a description. Make sure to click save at the bottom of the pop-up.
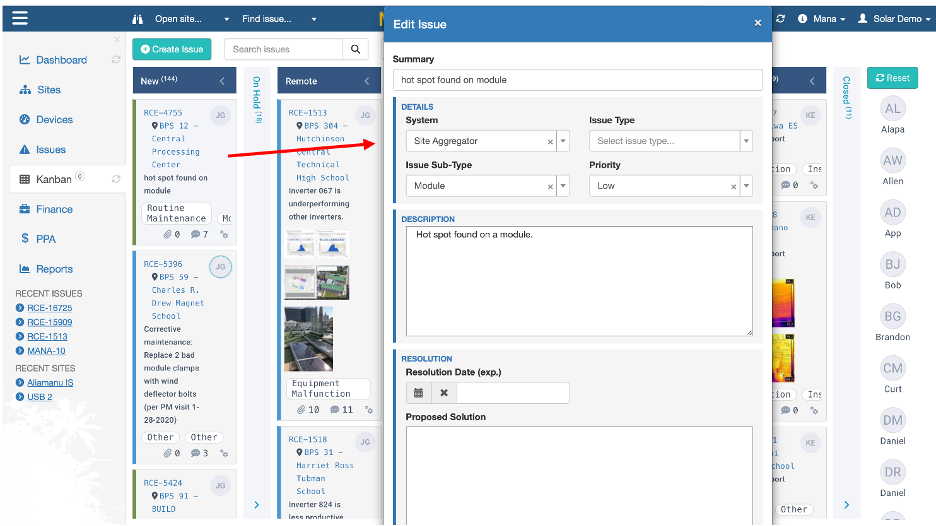
Tickets can be dragged and dropped as tasks are completed into their respective columns.
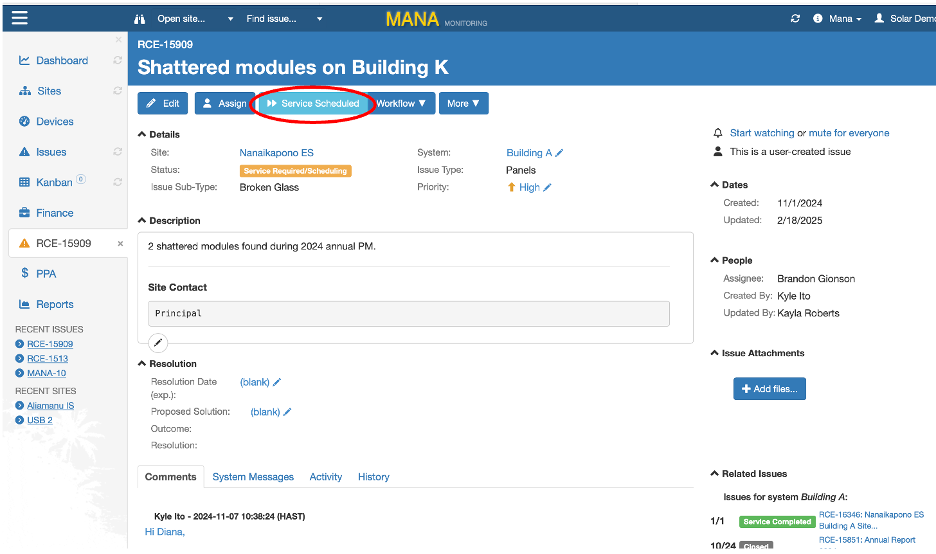
If an issue requires a service, this can be requested on the overview page of the ticket. This is accessed by clicking on the ticket title on Kanban. Selecting this will automatically move the issue to the right on Kanban.
Other features at this stage include making updates to workflow, creating subtasks, assigning issues, editing scheduling and more.
Finance Tab
Overview
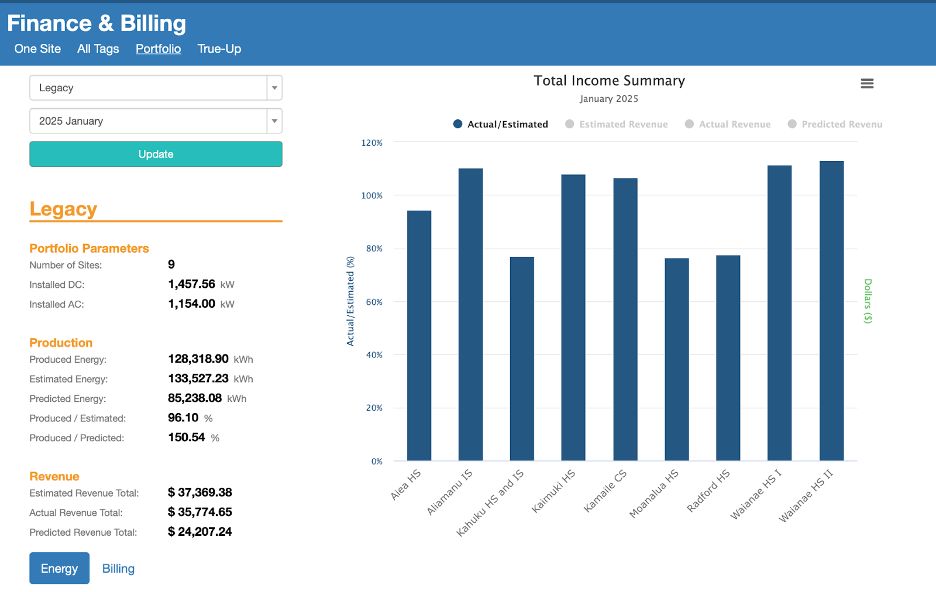
The finance tab allows users to visualize the performance of either a specific site or a group of sites filtered by tags.
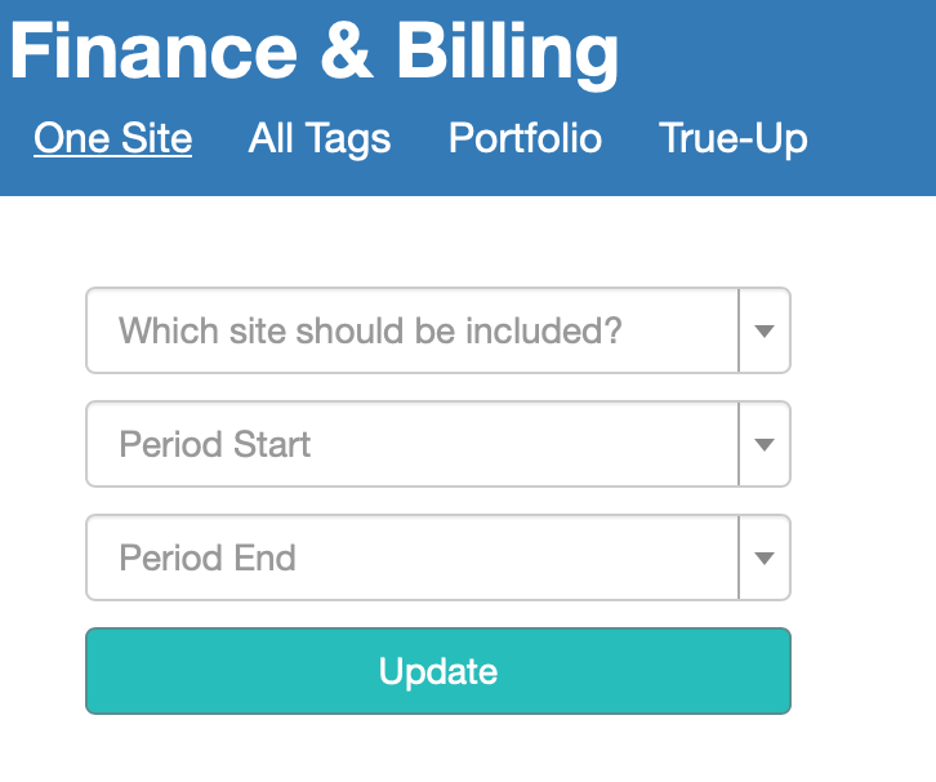
The portfolio tab shows financial asset managers the total income summary generated by production sites they have PPAs with. The finance tab enables these companies to generate PPA invoices for the production sites they are contracted with. .
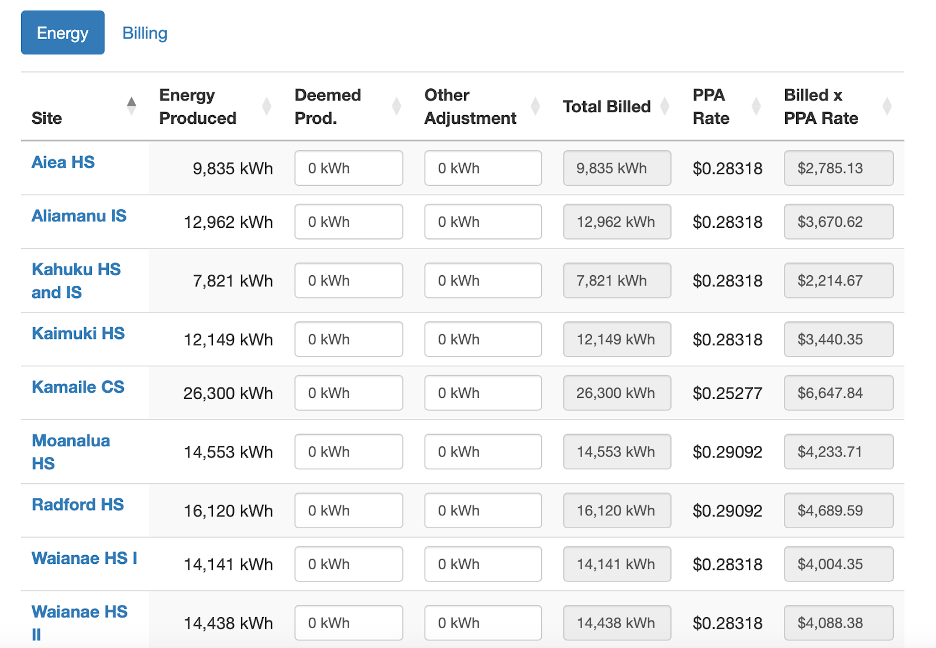
The energy sub-tab shows the PPA rate that is configured for each site and the total PPA price charged to each customer. This tab also includes blank spaces for Deemed Production or Other adjustments. Here, users can make corrections if there are any known issues on site, such as with Revenue Grade Meter or Inverter. If circumstances prevent production from being recorded, such as equipment failing or being offline, additional production can be added here.
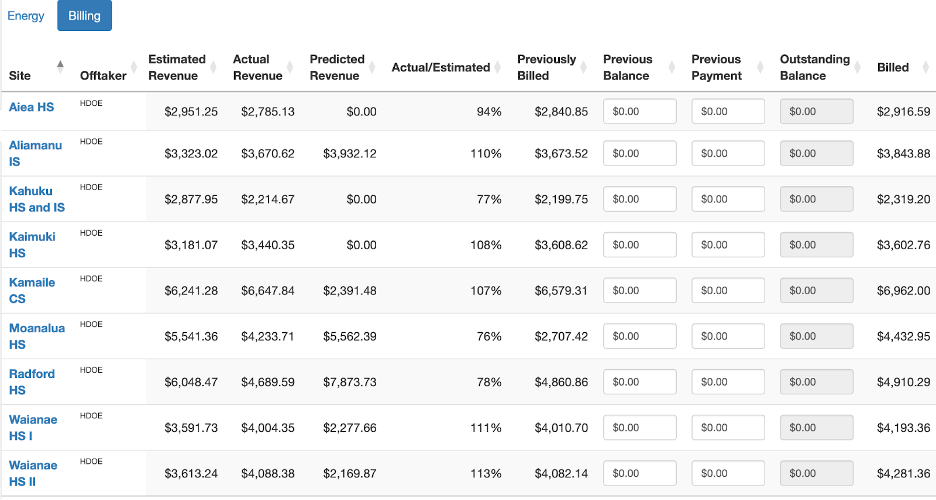
The billing sub-tab shows values for estimated, actual and predicted revenue. Some clients also display additional information on invoices that refers back to the previous billing period. On the right hand side of this tab, there are spaces to include this information, such as what the customer was billed last month and how much they paid.
True-Up
Finance users are encouraged to take advantage of the true-up feature, which makes adjustments to billed amounts of energy consumption versus actual amounts. If there is a quarterly or yearly reconciliation process with customers, they would have the chance to see if there's any need to issue a settlement invoice separately and charge additional fees. This feature helps customers maximize profits, as sometimes there are discrepancies between when invoices are sent out and the final values reflected on Revenue Grade Meters that Mana records.
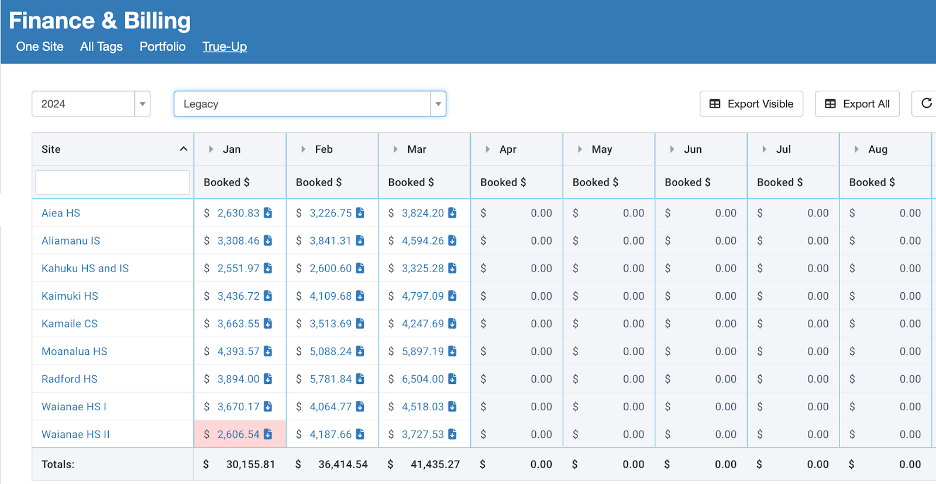
Once a PPA Invoice has been generated, it is “booked” and saved to the True-Up page. On this table, financial asset managers can observe all monthly PPA invoices that have been booked across production sites for any particular year.
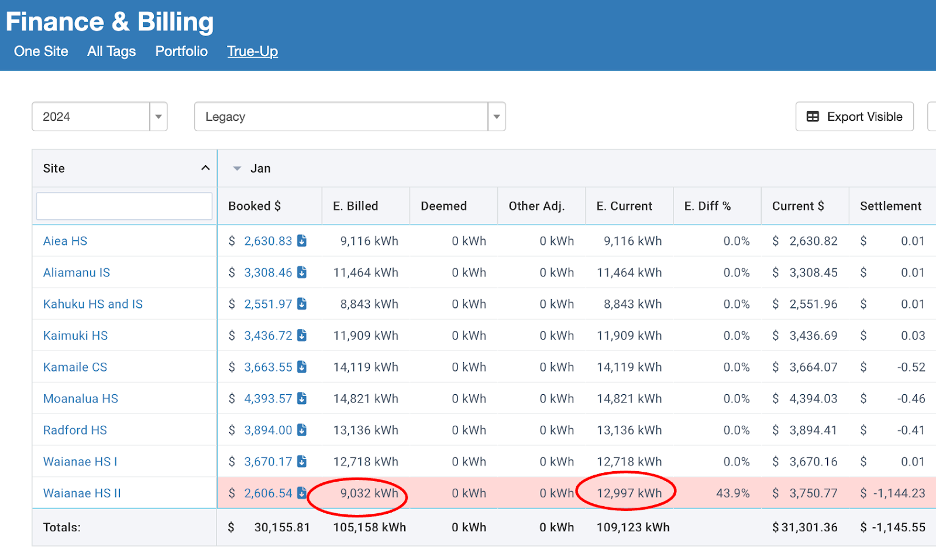
If they select a specific month, other useful information is also available, including Energy Billed (which is the amount of energy recorded at the moment in time when the invoice is generated) and Energy Current (which reflects the information on data readings from Mana). These two values may not always line up due to discrepancies in when data is being updated. Even when invoices aren’t booked under Energy Billed, the system still calculates the total energy that was actually recorded.
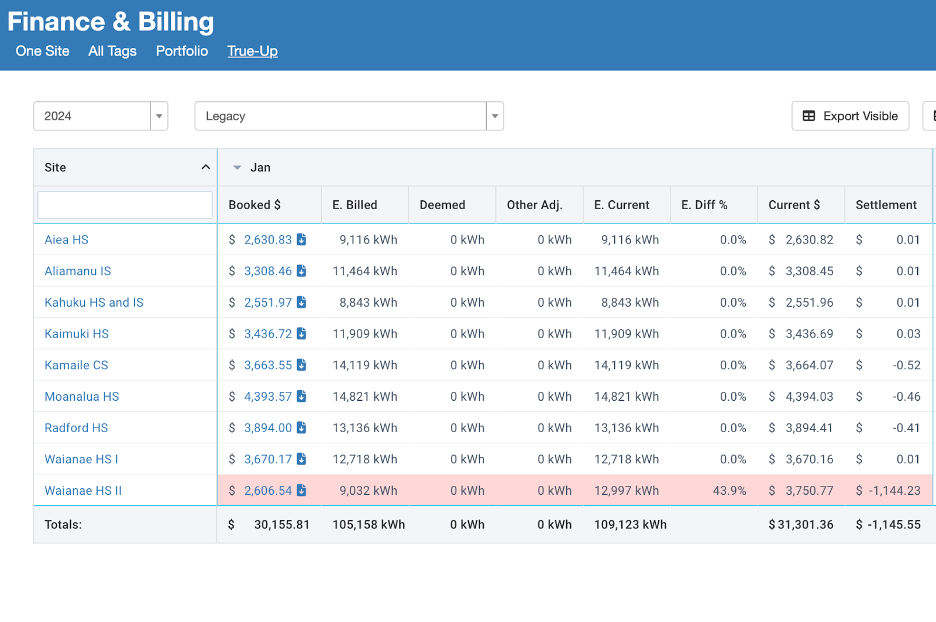
On the right hand side of the page, there are three red columns which indicate the summary of corrections that have been made across production sites. The “Booked” column reflects the sum of monthly booked figures. The "Current" column shows the total energy that was actually recorded by Mana. The "Settlement" column reflects the difference between these two values and thus indicates if there is any energy usage which was not reflected in the invoice.
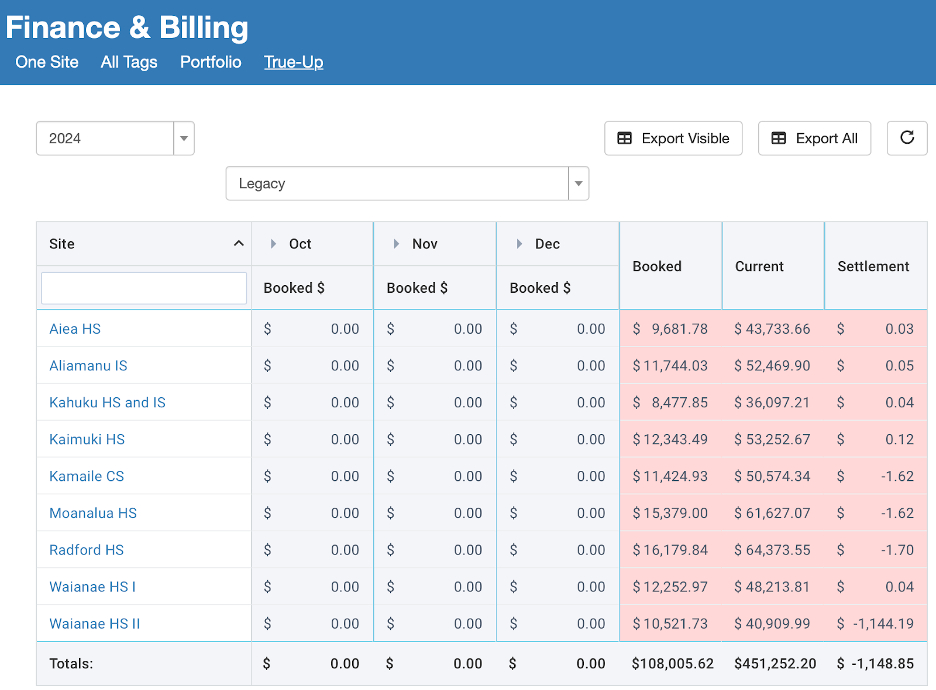
If there are tabs in this spreadsheet which are labelled red, this indicates that there is a deficit between the amount of energy that was billed and the amount of energy that was actually measured. In these cases, True-Up helps clients to identify sites which report unbilled usage that they should follow up with to account for lost income. Clients are encouraged to use True-Up as much as possible to maximize their revenue.
PPA$ Tab
Overview
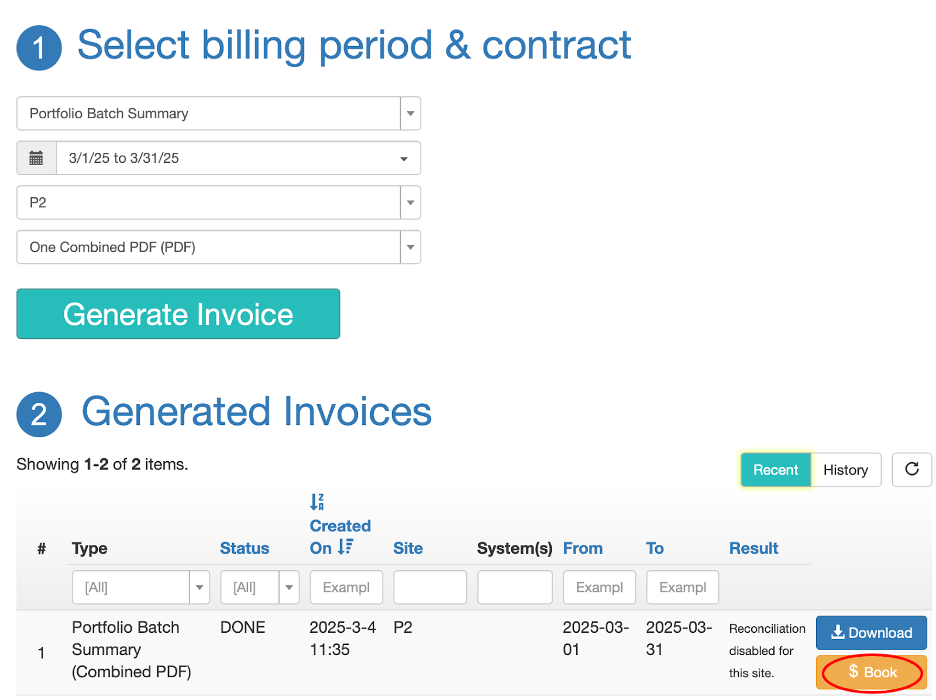
The power-purchase agreement tab is where invoices can be generated. These can either be generated for a specific site (Site PPA Contract) or at the batch level (Portfolio Batch Summary) for a specific period.
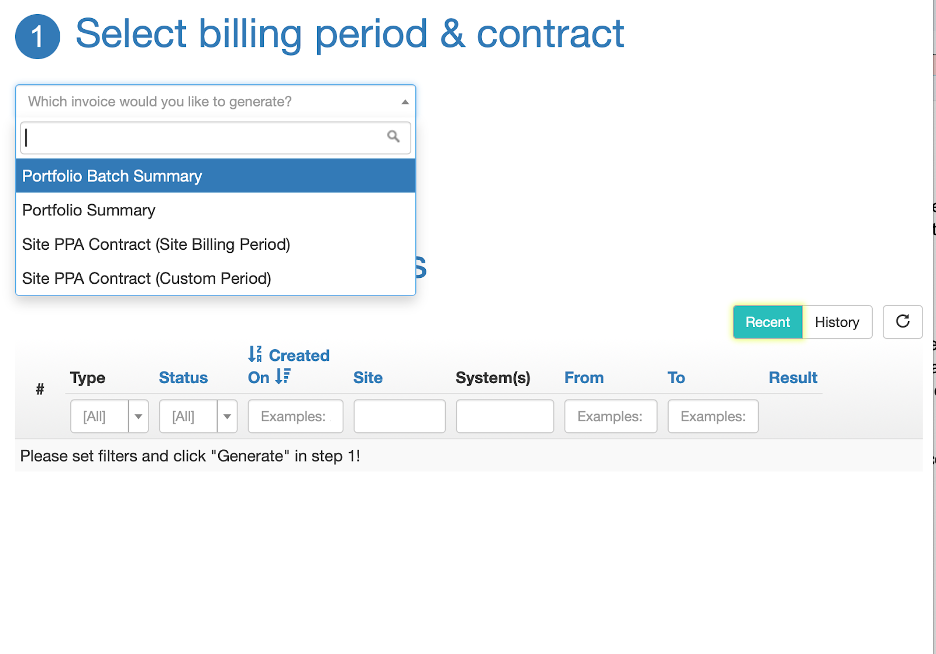
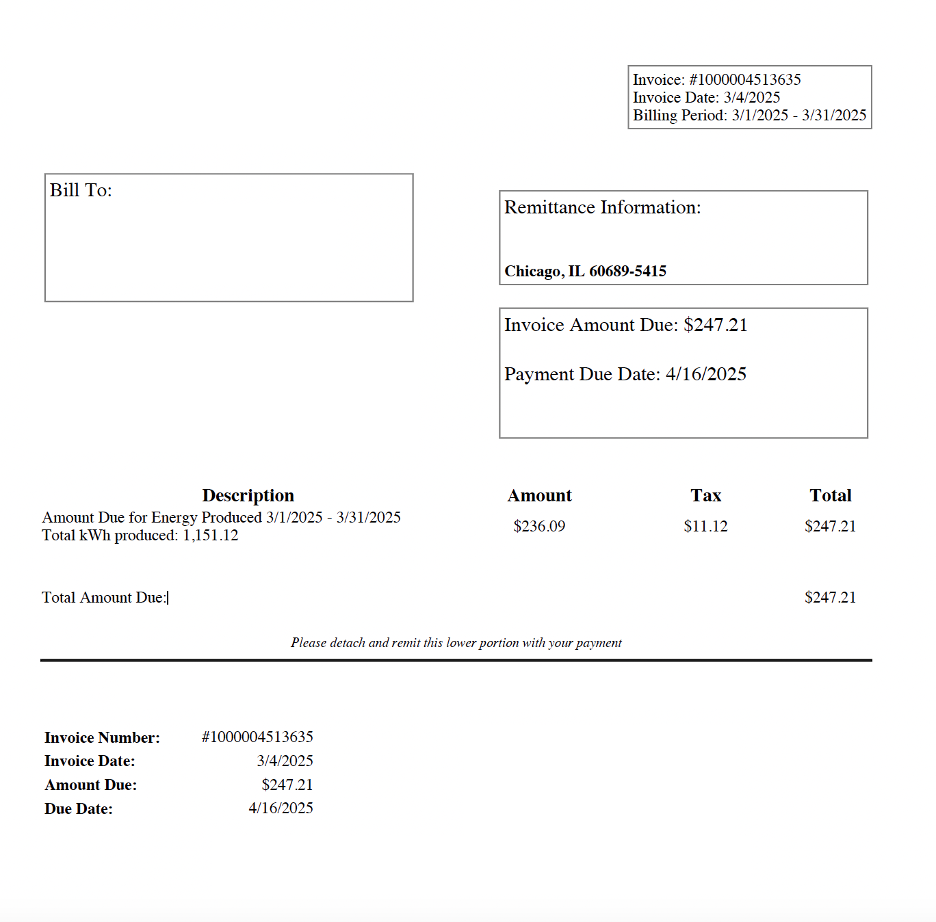
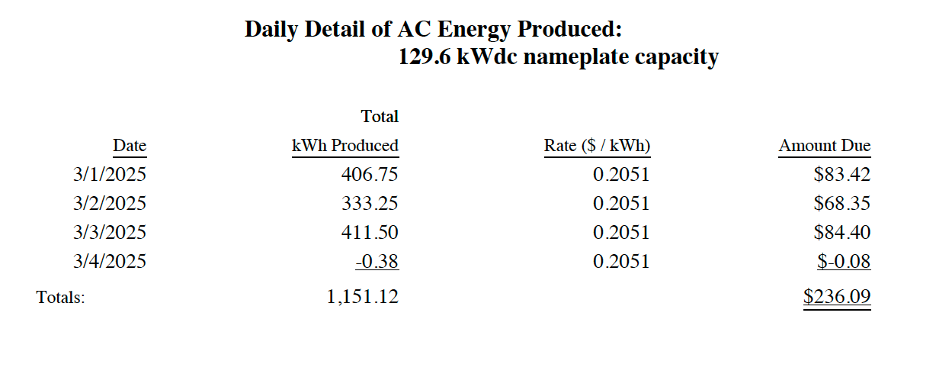
Invoices contain useful information, including total kWh produced, the PPA rate, and the total energy charge.
If everything on the invoice appears correct, the final invoice can be booked. This saves the invoice on True-Up where any deviations can be corrected (see True-Up for instructions).
Utility Report Tab
Overview
The Utility Report feature allows users to generate reports on their utility data.
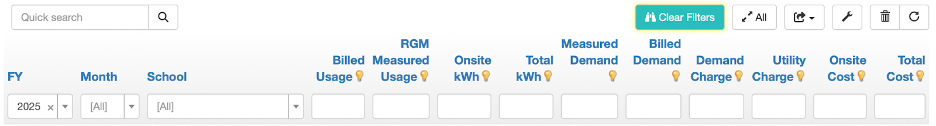
Billed usage - utility charges (kWh)
RGM Measured Usage - RGM measurements (kWh)
Onsite kWh - solar
Total kWh - billed usage + onsite
Measured demand - RGM Measured Demand (kW)
Billed demand - Utility demand (kW)
Total cost - utility charge + onsite cost
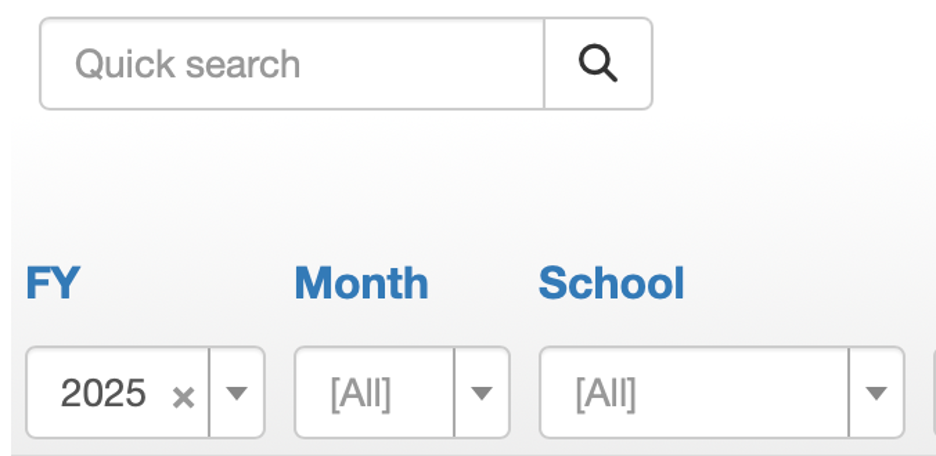
Using various filters, such as site tags, name of school, or fiscal year, users can generate reports using the export feature.
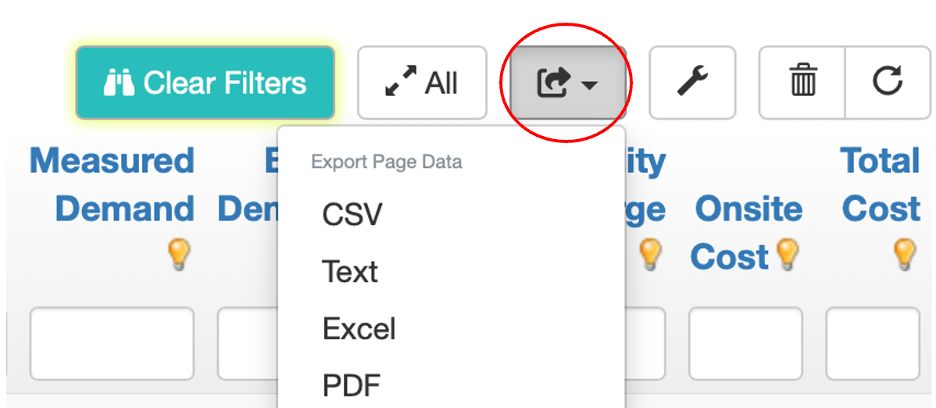
In excel formats, for example, sorting data from greatest to least according to different variables, such as demand charges, allows users to gain valuable insight into the performance of their sites and identify opportunities for lowering costs.
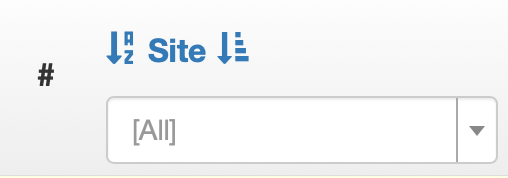
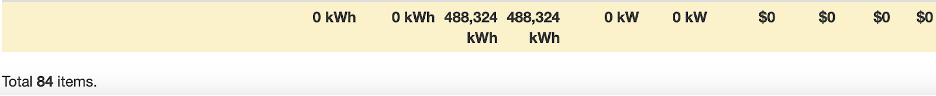
By selecting “All”, the standard page view is expanded to include all available data for a specific filter in the report.

Totals can be viewed at the bottom of the page.
Additionally, the wrench icon allows users to personalize the columns of the site page. Simply select the icon and use drag and drop to configure the most relevant categories. Users can also change the order that they're listed on the screen to group related ones.
Reports Tab
Overview
Mana makes a number of reports available to you depending on your subscription tier.
PPA and Tenant Billing Reports
-
Portfolio Batch Summary Report
Pre-configured PDF of PPA (power purchase agreement) bills that are compiled based on user defined portfolio/tags. -
Portfolio Summary Report
Pre-configured PDF summary of all the user defined billing(s) in a given portfolio -
Site PPA Contract
Pre-configured PDF PPA bill based on a site's energy purchase in a given period
General Reports
-
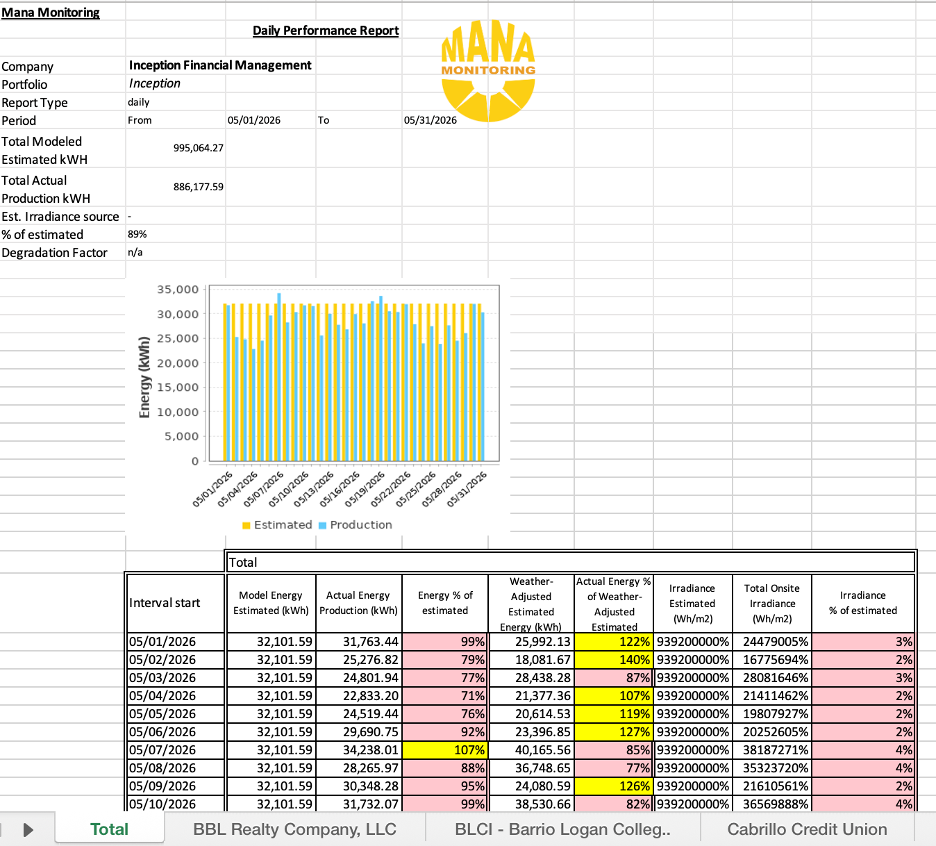
Client Production Report
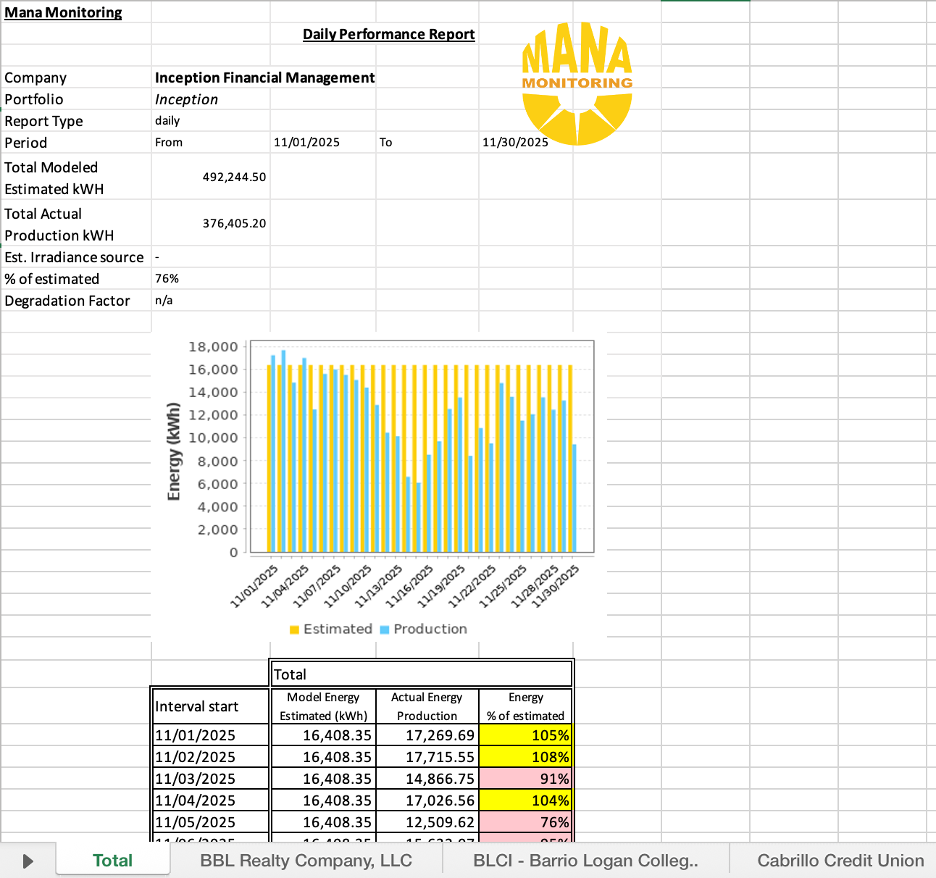
Master export of all of the client's sites/solar facilities and respective energy production on a daily basis. -
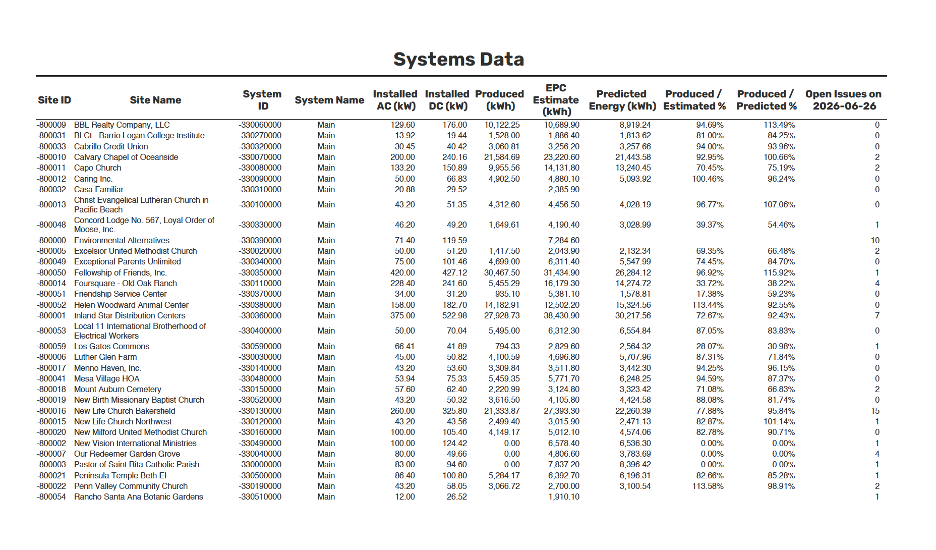
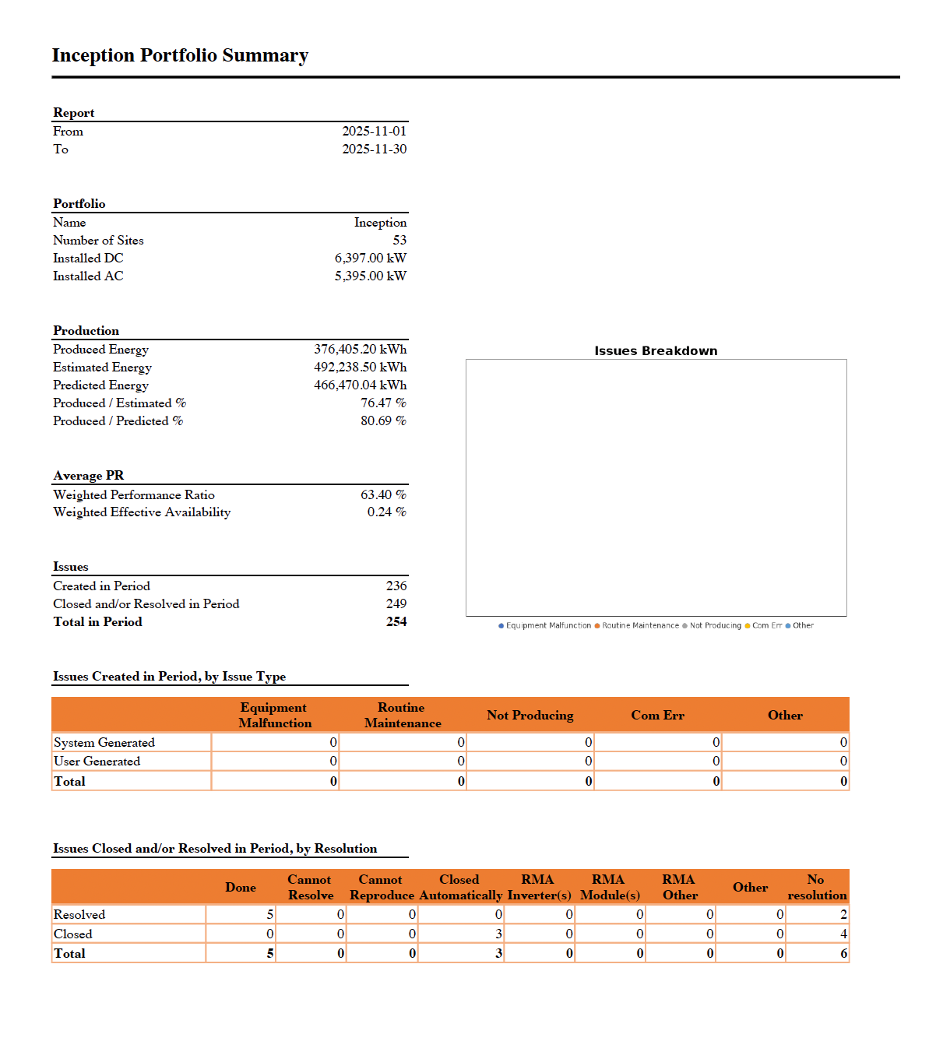
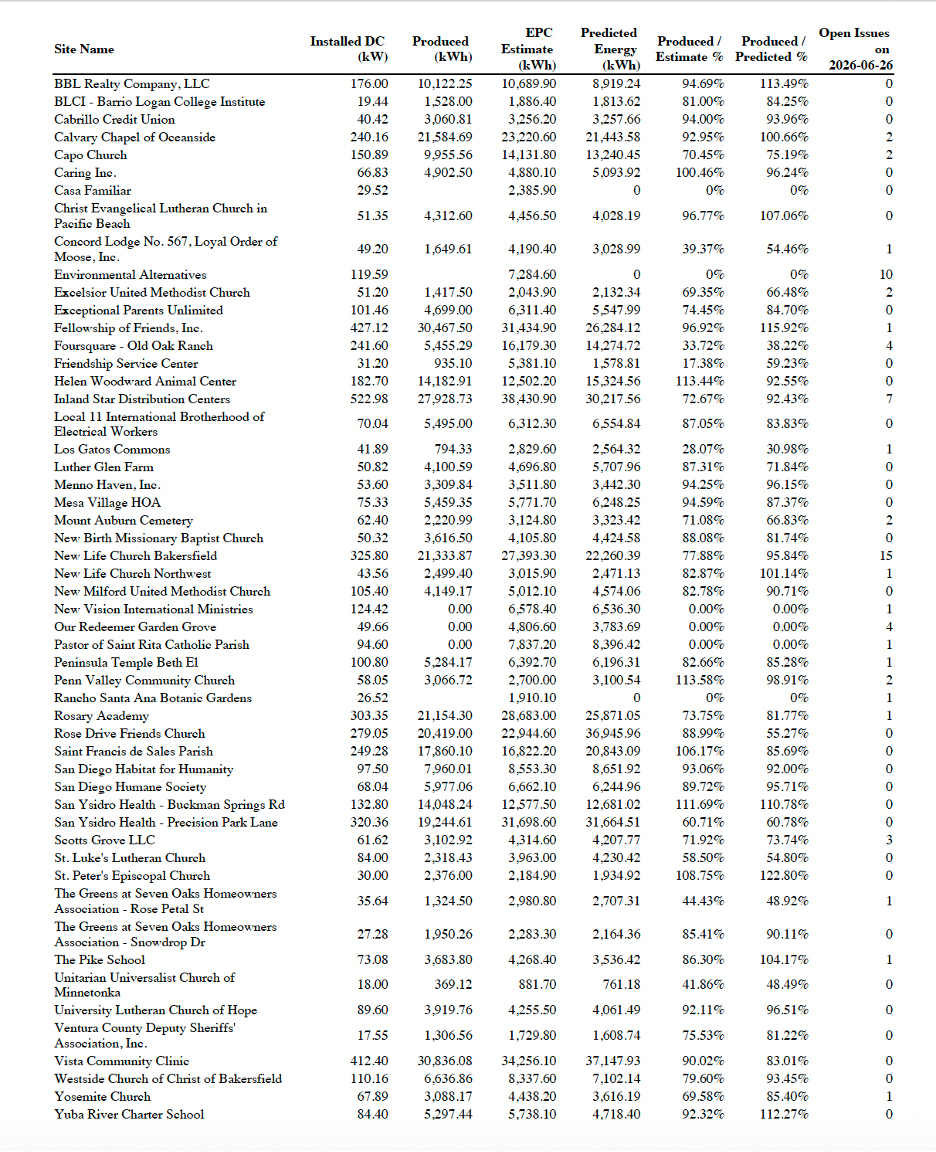
Portfolio Overview Report
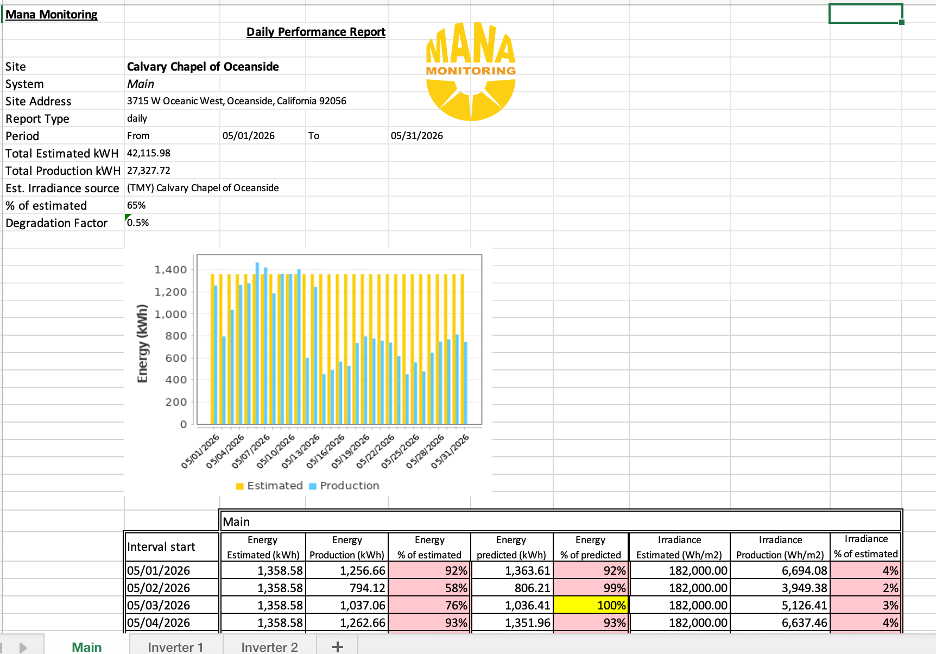
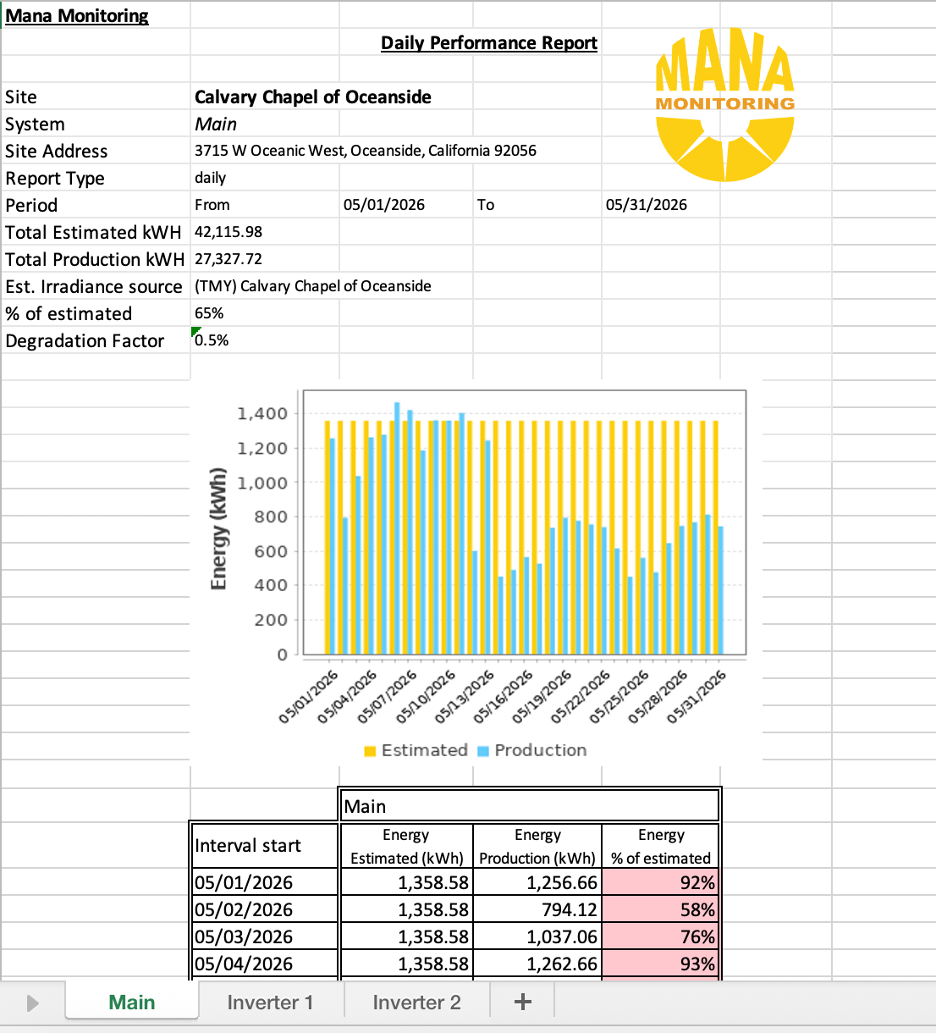
Pre-configured portfolio summary and site breakdown showing the actual vs. expected output and irradiance -
Portfolio Issues & Readouts Analysis
Master output of actual output vs estimated and predicted with a summary of open and closed issues/tickets within a user defined period -
Production Overview
Selected site report showing the actual vs. expected output and irradiance
Device Data
Additionally, you can export the data that Mana acquired from your meter devices in various formats. This is data that is stored on Mana's servers.
- Combined System Readings
- Effective Availability
- Device-level readings:
- Cumulative Energy / Momentary Power
- Cell Temperature
- Irradiance
- Aggregated readings from Virtual Master Meters
- Virtual Irradiance readings
Depending on the type of reading, it is available as raw data, normalized data (meaning it has been transformed to be consistent irrespective of device hw/configuration), hourly aggregated data, daily aggregated data, or monthly aggregated data.
→ Learn how to export device data
Remote Readings
Mana also provides a facility to export data directly from your devices. This is data that is extracted from the devices directly, or from your SCADA software.
→ Learn how to export remote readings
Website Table Data Export
→ Learn how to export table data
You can also export any table you see on the Mana website, for example:
Types of Reports
|
Name |
Type |
Content |
Main data sets |
|
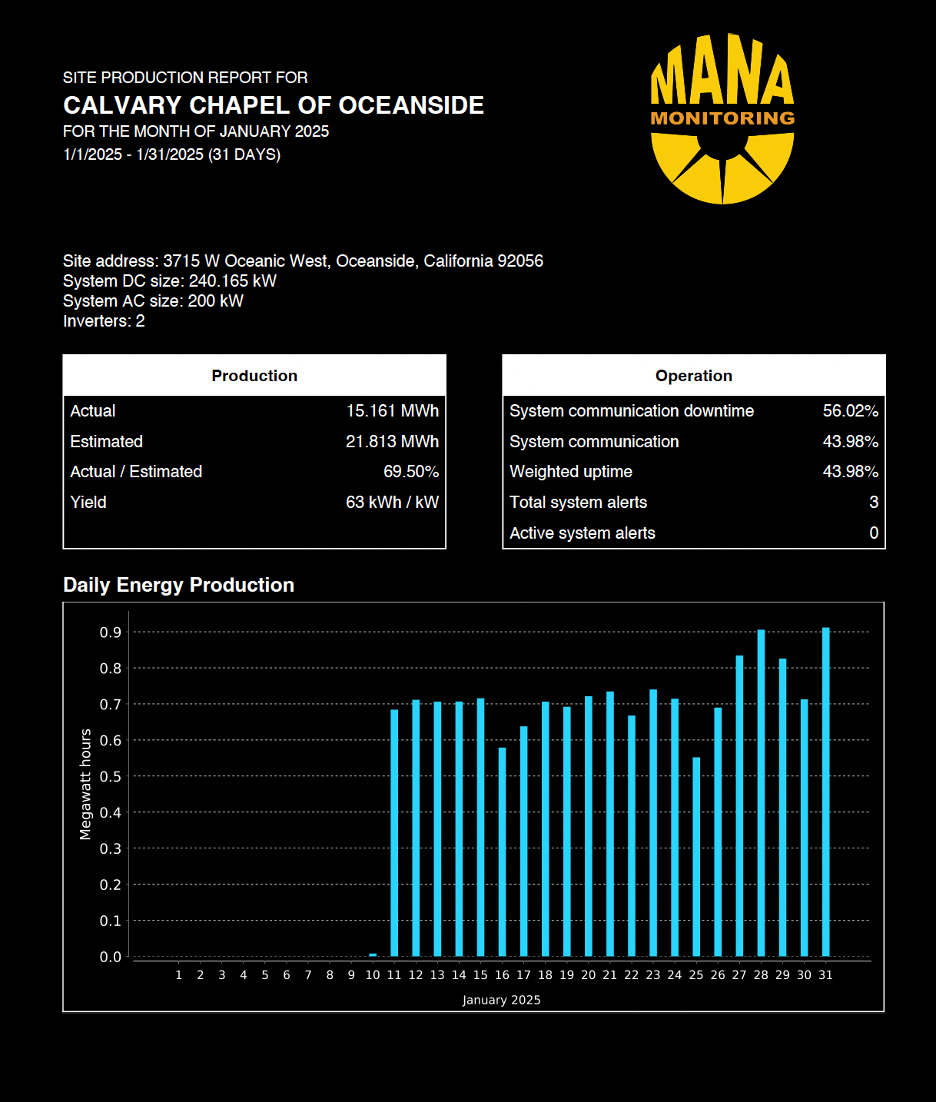
Advanced Site Production Report |
|
A two page report based on AlsoEnergy monthly report that contains monthly production data and operation / alert data:
|
|
|
Client production |
|
Granular report to list daily production, production estimate and predicted information both on site and subsystem / inverter level:
|
|
|
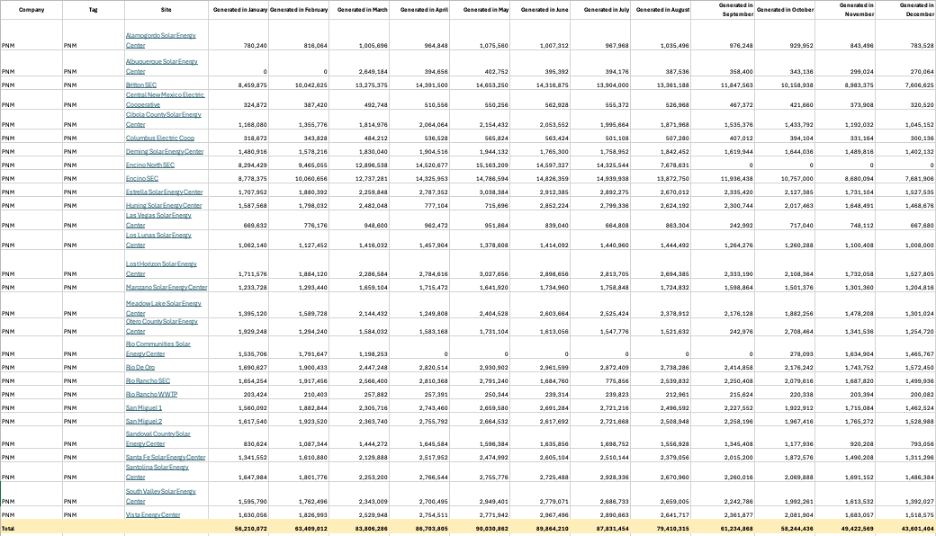
Monthly Portfolio Summary Report |
|
Report lists monthly production figures (kWh) for each site under a certain portfolio |
|
|
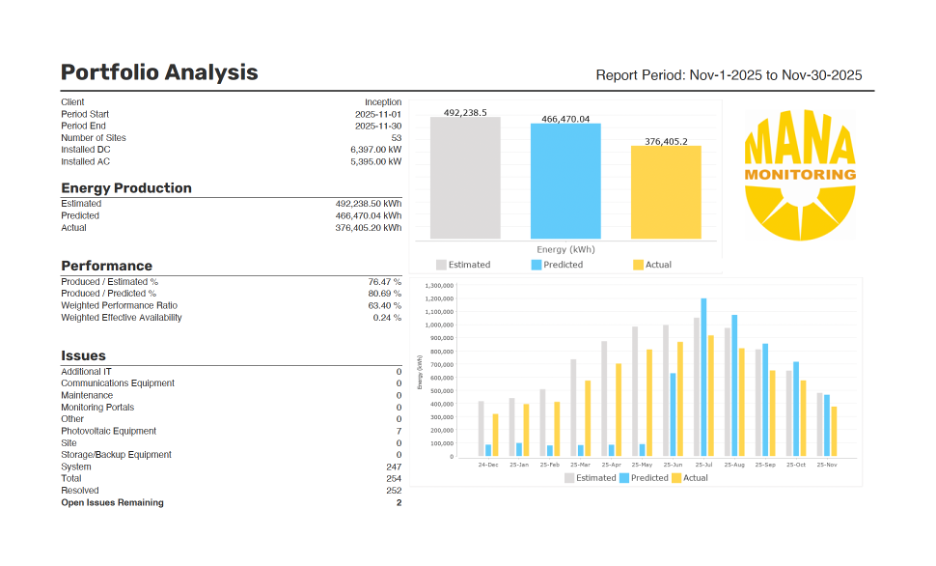
Portfolio Analysis |
|
Report to review the production, performance of the a certain portfolio plus issue analytics:
|
|
|
Portfolio Issues & Readouts Analysis |
|
Report with almost the same content as "Portfolio Analysis" extended with issue analytics:
|
|
|
Portfolio Overview |
|
Report with key metrics about the respective portfolio + individual sites on separate sheets:
|
|
|
Portfolio Overview Basic |
|
The very same report as "Portfolio Overview" but without irradiance data |
|
|
Production Overview |
|
The very same report as "Portfolio Overview" that can be generated either for a site or just for a particular subsystem / inverter at the site (depending on last reporting criteria) |
|
|
Production Overview Basic |
|
The very same report as "Portfolio Overview Basic" that can be generated either for a site or just for a particular subsystem / inverter at the site (depending on last reporting criteria) |
|
|
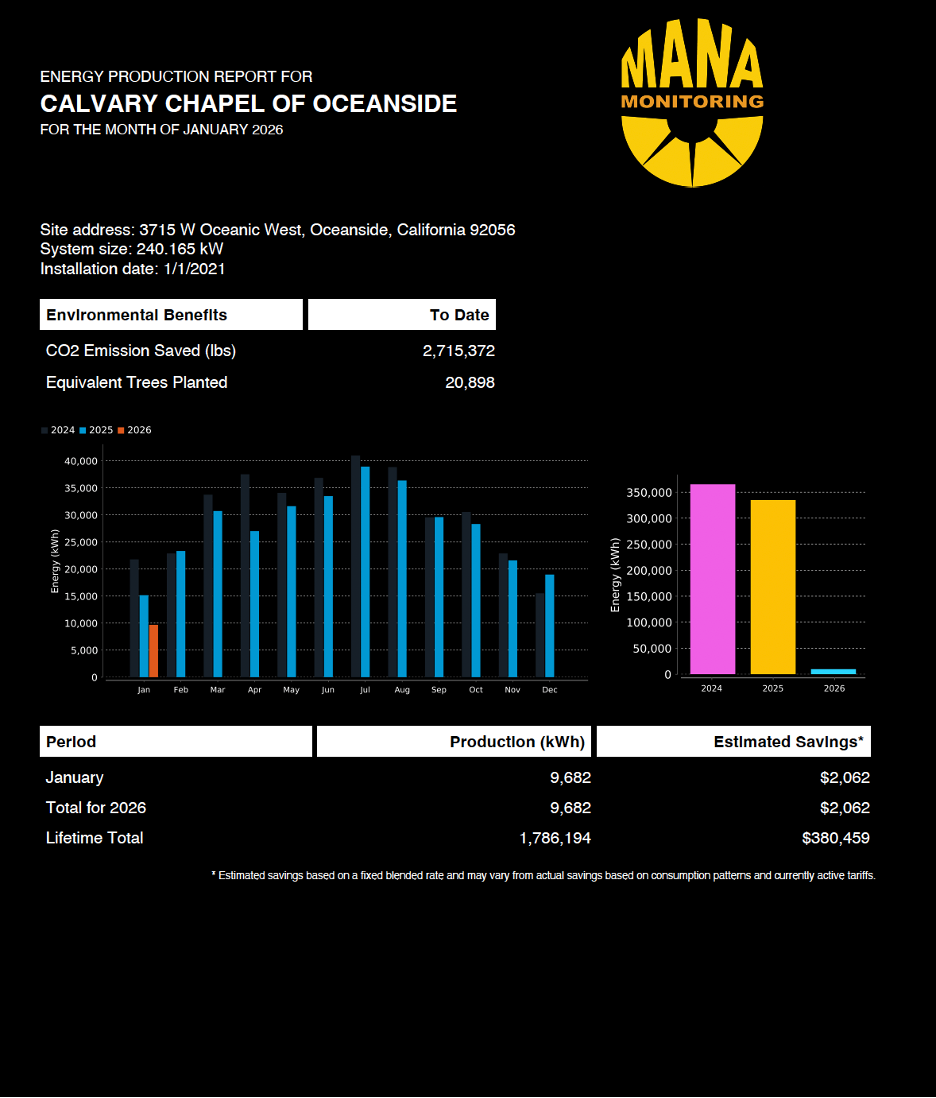
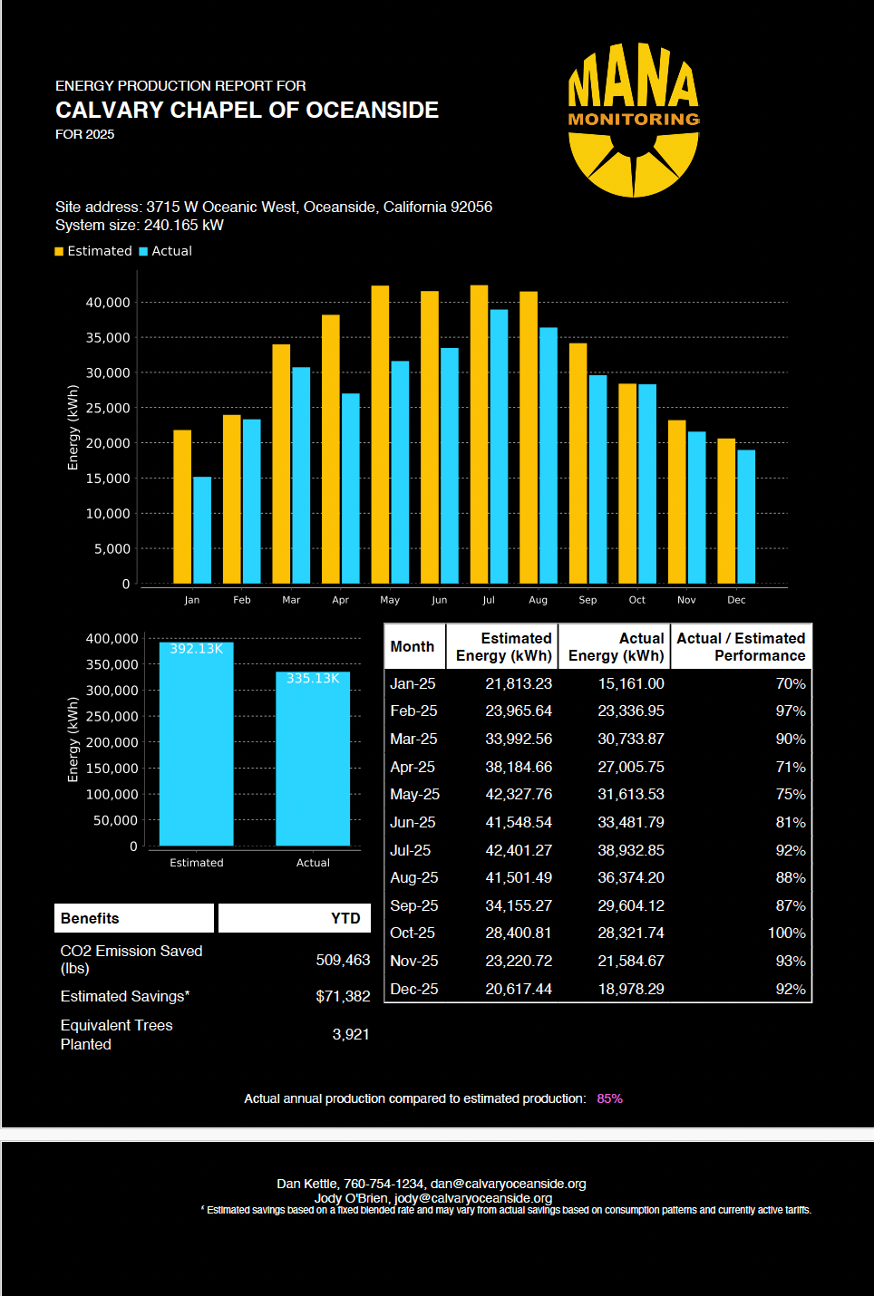
PV report |
|
Summary report for a particular site production in a specific year with 3 years comparison + environmental benefits + estimated savings:
|
|
|
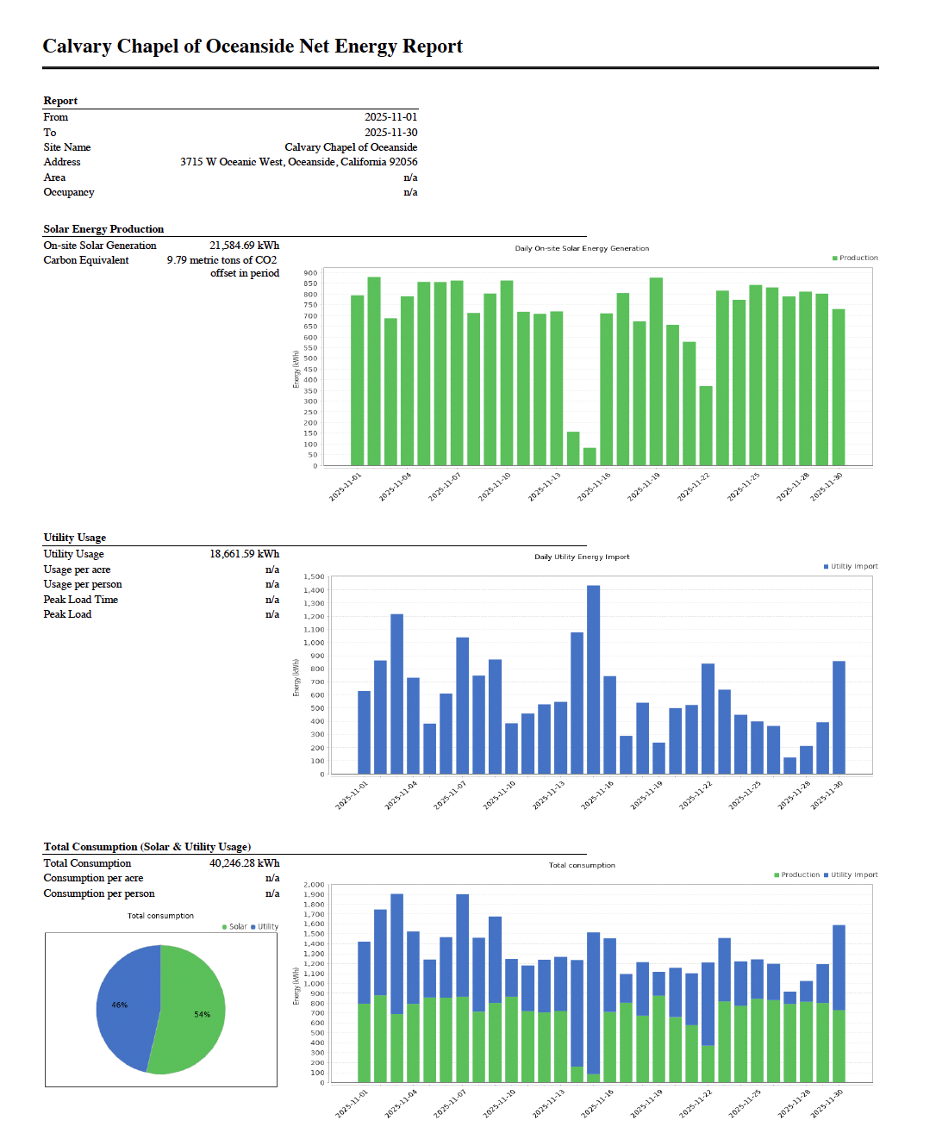
Site Net Energy Report |
|
Report includes a breakdown of :
|
 |
|
True Up Report |
|
True-up report with key information for a specific year:
|
|
|
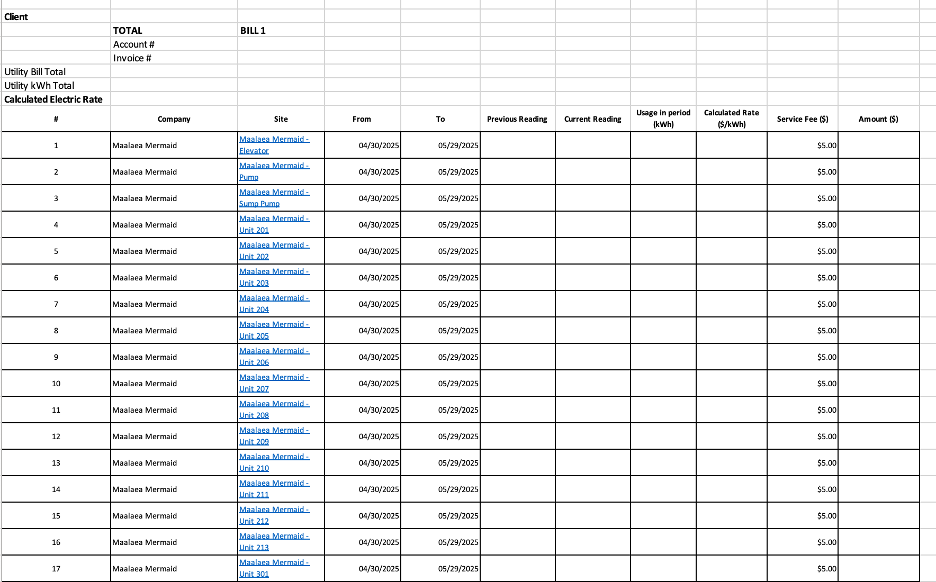
Tenant Utility
|
Format: .xlsx
Granularity: Portfolio
Period: Month |
Breakdown of energy usage during billing period across units. Includes calculated rate and total amount due. |
|
Generating Reports
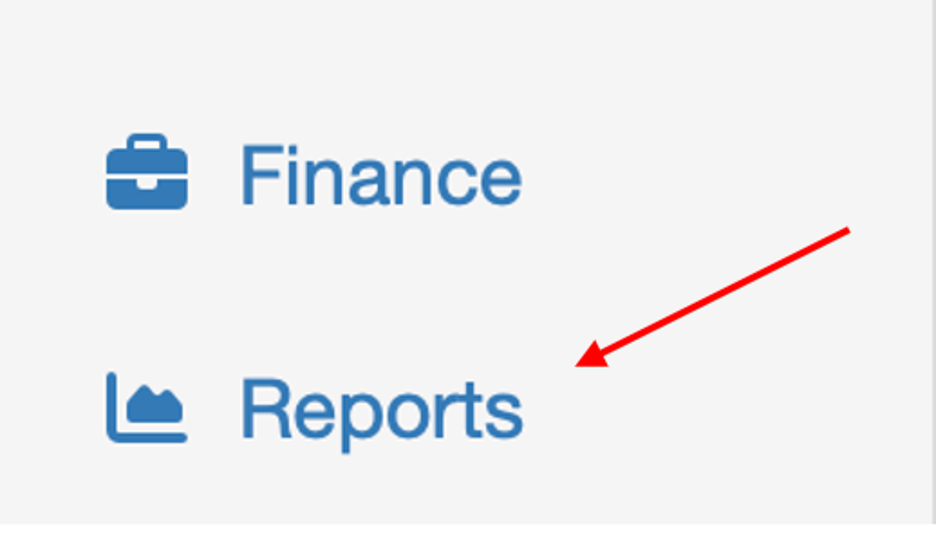
To generate a report, select the reports tab on the left hand side of the dashboard.
Next, select the filters you wish to generate a report for, including the type of report, the time frame, and the format.
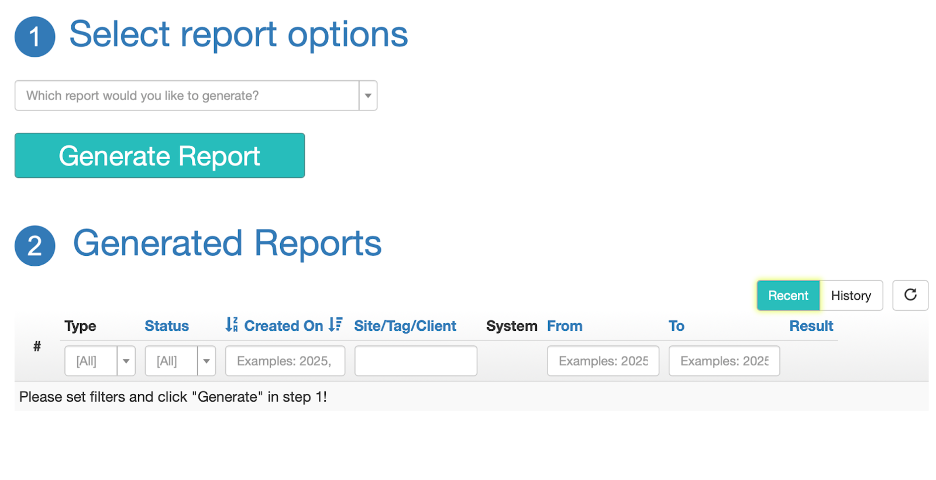
Once you’ve generated your report, it is good practice to reload the data before downloading.
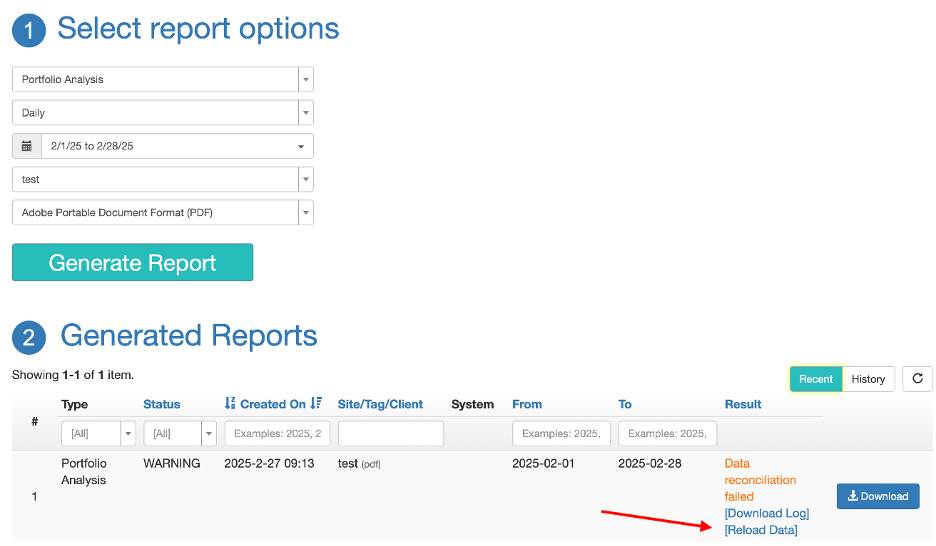
Validate Data in Generated Reports
When you generate a report, the system inspects whether the data in the report has been validated at some point in time. If it finds any indications that the data may not be valid, a warning is displayed and you are given the opportunity to download the reconciliation log and you may also attempt to reload the data:

Hovering over the "Download Log" link you are shown a summary of systems where data may not be valid:

Download the Validation Log
Click on the [Download Log] link to do so.

The report contains the following columns:
- Timestamp: this is the date that the energy readouts refer to
- Sample Time: this is the date that the measurements were extracted from the device - this may correspond to the Timestamp, but it may fall on a later date if the device was offline for a while and the data was only extracted later, or if the data had to be reread from the device due to data validation failures (during a data reload)
- Site ID: the internal ID of the site, you may use this ID when communicating with Mana to identify a site
- Site Name
- System ID: the internal ID of the system
- System Name
- Aggregator? This is "1" for systems that have subsystems, 0 otherwise
- Device ID: the internal ID of the device that supplied the data (this would be the PRIMARY production/consumption device of the system)
- Device Name
- Validation Date: this is the date when Mana validated the data
- Total Energy Output MANA: this is the sum of energy readings that Mana has for that day for that device, this is the value that appears in reports and on various pages on the Mana website
- Total Energy Output Remote: this is the sum of energy readings for that day as returned by the device during validation, it should match the Total Energy Output Mana if validation was successful
- Discrepancy: (Total Energy Output MANA - Total Energy Output Remote) / Total Energy Output MANA
- Explanation
The validation status for a given device/day can be one of the following:
- Data validated successfully: the data was successfully validated on the date shown in the Validation Date column; this does not mean that the data at Mana matches the data on the device in the present
- Date has not been validated yet (because system is offline): the data will be validated once the system comes back online
- Date has not been validated yet (system is reporting 0 production): the data will be validated once the device starts reporting positive values again
- Date has not been validated yet: the data has not been validated yet for an unknown reason
- Date will be validated at end of day: not enough time has elapsed for validation to run
- Reconciliation invalid: local readings have changed: this indicates that the data was validated at some point in time in the past, BUT the local readings have changed since then, therefore it needs to be revalidated; this may come up if the data was manually reloaded from the device
- No production: 0 production was read from the device for the given day, and upon reconciliation the device confirmed that there was no production on that day; this usually implies that Mana is working OK but there is some issue on-site (inverter failure etc.)
- Site has not reported energy (because system is offline): the device has not reported any energy for that day, Mana will backload the data and validate it once the system comes back online
- Site has not reported energy (system is reporting 0 production): the device has been reporting 0 production, the Mana will backload the data and validate it once the system starts reporting positive values again
- Reconciliation failed: this indicates that the data needs to be reloaded (use the [Reload Data] button!)
Note that all information is refreshed when you download the report, so if you download the reconciliation log for a report generated in the past, the validation status will be the status on the day when you download the data, not the status that was known when the report was generated!
FAQs
How do I identify site issues?
A starting point is the overview map on the dashboard and checking new notifications at the bottom of the page .
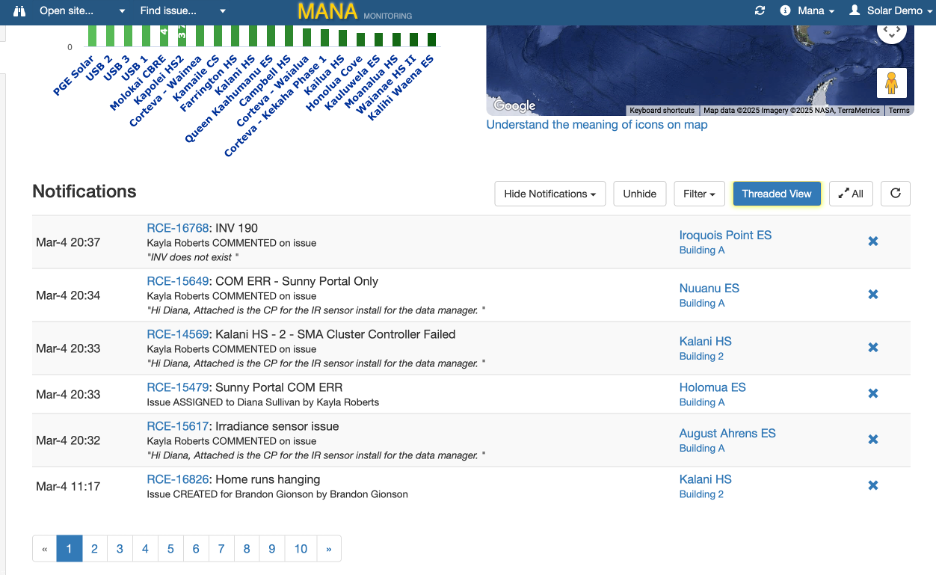
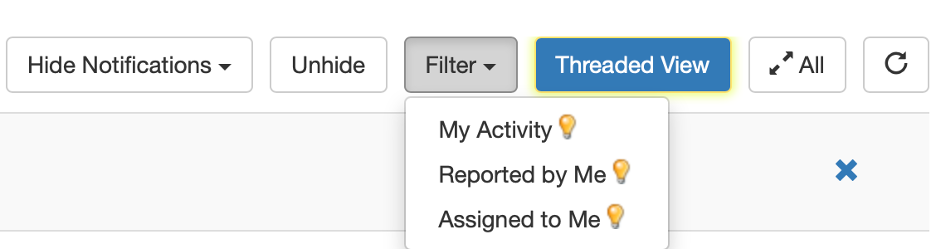
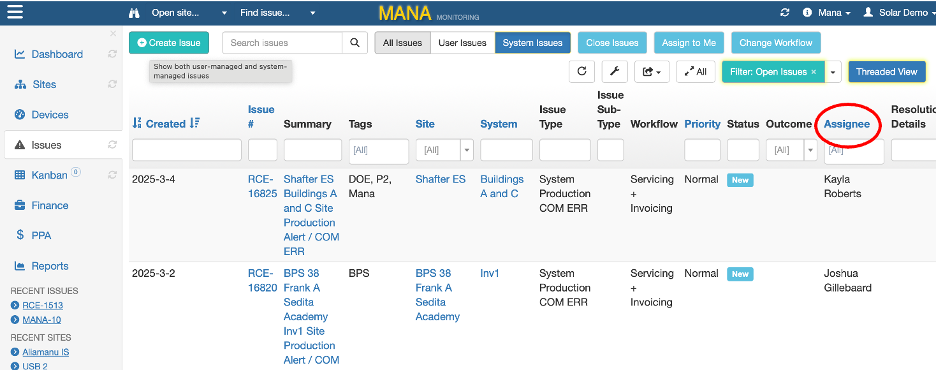
The filter bar allows users to view specific notifications that have been assigned to them.
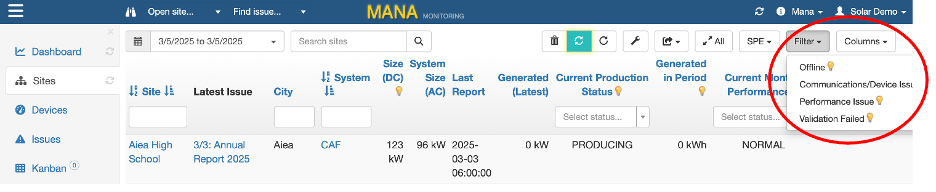
Users can also open the sites list and using the Filter drop down to search for sites that are Offline, have Communications/Device Issues, or Performance Issues.
The user can also use the Issues tab or the Kanban to review recently generated system issues.
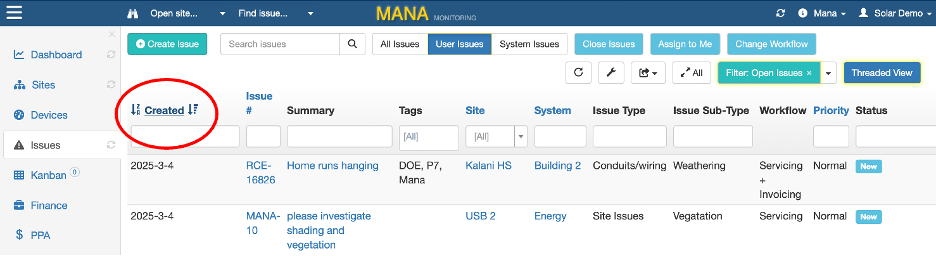
On the issues tab, issues are listed in order of those most recently published by default. However, selecting the "Created" label allows users to re-order them to list older issues first if necessary.
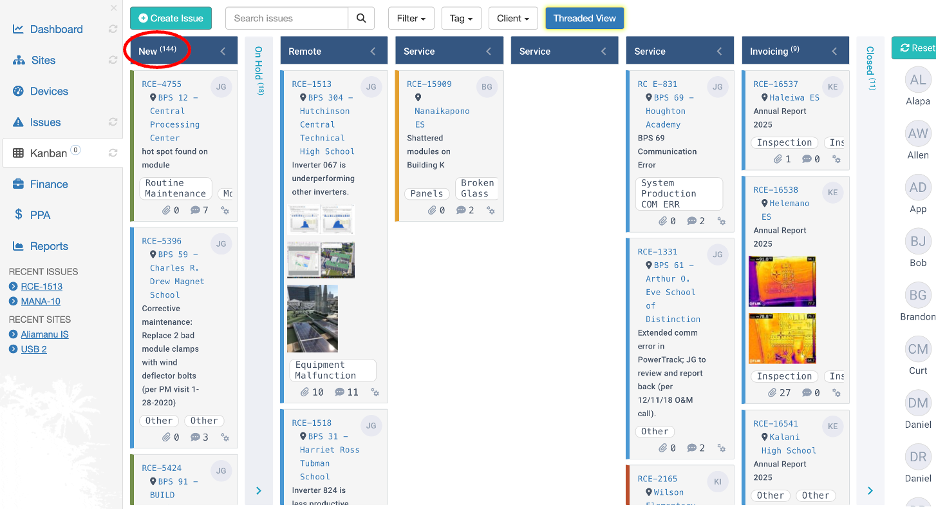
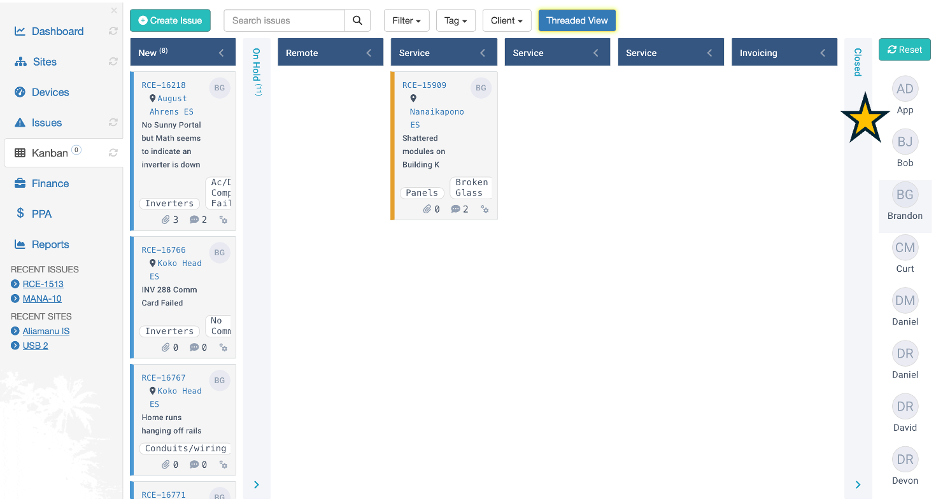
On the Kanban tab, new issues are listed on the left.
How do I work with issues assigned to me?
How do I calculate the carbon equivalent of solar PV production?

To Calculate the Carbon Equivalent of Solar Photovoltaic production Mana uses the Environmental Protection Agency's (EPA) published formula:
Emission Factor
1,559 lbs CO2/MWh × (4.536 × 10⁻⁴ metric tons/lb) × 0.001 MWh/kWh = 7.07 × 10⁻⁴ metric tons CO2/kWh
Mana's algorithm takes the aggregate value of all the renewable energy produced in the current year to date, and uses the aggregate kWh value to calculate the carbon equivalent.
For more information visit:
https://www.epa.gov/energy/greenhouse-gases-equivalencies-calculator-calculations-and-references
How do I configure notifications?
Notifications can be delivered via email or reviewed on the Mana Website.
On the website, you can see your most recent notification on the Dashboard page. You can also hide any notifications that you've read.

Issue Notifications
You can opt to receive notifications of the following issue-related events:
| Notification Type | Explanation |
| Issue Created for Me | When a new issue is created, the system sends a notification to the assignee. |
| Issue Assigned to Me | When an existing issue is assigned, the system sends a notification to the new user. |
| Issue Status Changed | When an issue status is changed, the system sends notifications to the issue creator and assignee. |
| Issue Deleted | When an existing issue is deleted, the system sends notifications to the issue creator and assignee. |
| Issue Comment Added | When a comment is added to an issue, the system sends notifications to the issue creator and assignee. |
System Status Notifications
You can opt to be notified of the following types of system-related events:
| Notification Type | Explanation |
| System Production COM ERR | The system production meter status has been COM ERR for a certain amount of time. |
| System Production NOT PRODUCING | The system production meter status has been NOT PRODUCING for a certain amount of time. |
| System Production COM ERR Resolved | The system production meter status was COM ERR but has returned to NORMAL. |
| System Production NOT PRODUCING Resolved | The system production meter status was NOT PRODUCING but has returned to NORMAL. |
| System Consumption COM ERR | The system consumption meter status has been COM ERR for a certain amount of time. |
| System Consumption COM ERR Resolved | The system consumption meter status was COM ERR but has returned to NORMAL. |
System Performance Deviation Notifications
You can opt to be notified of the following types of system-related events:
| Notification Type | Explanation |
| System Production DEVIATION | System momentary power production has deviated from predicted power by a certain amount for at least a certain amount of time. |
| System Production DEVIATION Resolved | System momentary power production had deviated previously, but has now returned to within the expected envelope for a certain amount of time. |
The methodology for determining whether a system is deviating from expected is as follows:
Production Performance = Momentary Actual Power Reading / Predicted Power
If the production performance falls below the minimum threshold (%) or exceeds the maximum threshold (%) for a certain amount of time (the duration threshold), then an issue is created and a notification generated.
You can review the momentary actual power vs. predicted power on the analytics page for the given system, just make sure the "Predicted Power" series is on:

If you are an administrator, refer to the Mana Administrator's Manual, System-specific Issue Generation Settings for a technical overview of how issue generation and notifications work, or the System Statuses and Icons chapter to understand when a system status change occurs that can trigger a notification.
Enabling/Disabling Notifications for a System
The different types of notifications that can be automatically generated for a system can be turned off for a given system.
Note that if you turn off a type of notification for a system, then such notifications will also be turned off for the subsystems of that system as well!
To set these system-specific settings, open the site details page (from the sites list page or using the sites quick-access drop-down). Then, click on the little envelope next to the given system:

You can turn COM ERR and/or NOT PRODUCING notifications on or off, and you can also set a timeout. For an overview of the options available, see System-specific Issue Generation Settings in the Mana Administrator's Manual.
A Word on Timeouts
There are two timeouts that affect system status notifications.
First, the website can be configured to wait a specified amount of minutes before setting a system's status to COM ERR. This is to allow some lag in communications between the device(s) and Mana. This timeout can be set on the system form:


Second, the website can be configured to wait a specified amount of minutes after a system has stopped reporting before creating a COM ERR issue. Similarly, a timeout can be set after a system has stopped reporting non-null values before a NOT PRODUCING issue should be created.
Note that the issue generation timeout is not in addition to the COM ERR timeout, but the COM ERR timeout must elapse before a system state is set to COM ERR. In other words, the largest value set in either the system COM ERR timeout or the system COM ERR Notifications timeout must elapse before a COM ERR notification is created.
Notifications Q&A
We shall extend the notification threshold to 48 hours for Enphase, Fronius & APsystems sites. It shall be applied both for "communication error" and "not producing" notifications. Please let me know what needs to be configured
Answer: Depends on what you want. Assuming that a system hasn't reported for over a day, do you want:
- the system status to show COM ERR, you just don't want any issues created
- you want the system status to remain in whatever it was (normal/over/underproducing) for up to 2 days if readings aren't coming in (and since the status doesn't change, no notifications are sent)
If you want the system status (and icon on the map) to show that there is a COM ERR, but just don't want issues to be created (#1 above), then set the timeouts on the notification control panel for the system:
If you want the system status to stay in "PRODUCING" even if the system hasn't reported in over a day (#2 above), then just set the COM ERR timeout on the system form. I would start by just doing this, so just set the system COM ERR timeout to 2880 minutes on the system form:
This was the system should tolerate timeouts of at least this long before the status enters COM ERR or NOT PRODUCING. And since the system status doesn't change no issues should be generated.
Note for administrators: if this is what you do, then also update the timeout in ID!
f you set the timeouts on the notifications control panel for the system, then you don't need to update anything in initial data.
If you are an administrator, refer to the Mana Administrator's Manual, System-specific Issue Generation Settings for a technical overview of how issue generation and notifications work, or the System Statuses and Icons chapter to understand when a system status change occurs that can trigger a notification.
How do I calculate effective availability?
Effective Availability
EA Calculation
Effective Availability is calculated for each aggregator system as follows:
$$Ea\%\ =\ \frac{Energy\ Produced}{Energy\ Produced\ +\ Energy\ Lost}$$
It is calculated on a granular level (depending on the readout frequency, i.e. for every 5 or 15 minute period). The daily EA is calculated the same way but of course the values are for the whole day. The daily Energy Produced and Energy Lost values are determined by summing the values calculated on the granular level for the given day.
EA is only calculated "when the sun is shining", which means that if the site is not expected to be producing, then EA is not calculated at all for that 5 or 15 minute period. Irradiance as well as the current average power production of all subsystems are used to determine whether all subsystem of a given system are expected to be producing. This is necessary since we don't expect units to produce in the dark.
The exact algorithm to determine whether a system is expected to be producing is as follows:
If an irradiance threshold is not set for the site, or irradiance is unavailable,
and the sum of the average power of all subsystems during the previous period exceeds the minimum power threshold
→ then all subsystems are expected to be producing
Otherwise, if irradiance threshold is set for the site
and irradiance readouts are available
and the current measured irradiance exceeds the irradiance threshold
→ then all subsystems are expected to be producing
Otherwise
→ the site is not expected to be producing (no EA is calculated)The Minimum Power Threshold is determined as 1% of the sum of module outputs for the given system.
The Irradiance Threshold can be set on the site configuration form for the whole site:

Energy Produced is calculated simply as the sum of the readouts of all subsystems.
Energy Lost is calculated based on the energy produced by units (which we call subsystems) that are online, if available:
$$Energy\ Lost\ =\ Energy\ Produced\ *\ \frac{DC\ Size\ of\ Units\ Offline\ +\ DC\ Size\ of\ Units\ Not\ Producing}{DC\ Size\ of\ Online\ Subsystems}$$
DC size of units is determined from the Module Output of the system, which in turn is the sum Wattage * Device Count of all "Module" type devices registered to that system. In case of virtual aggregator systems, this value is calculated from its subsystems that do have modules.
A subsystem is considered online in the context of the above equation if it produced at least 0.5 kW over the preceding period at an average power of at least 0.1% of the rated module output.
A subsystem is considered not producing if it is reporting values, but these values are below the threshold explained above.
A subsystem is considered offline if readings are unavailable.
If no subsystems are online, then we use the predicted hourly output for the aggregator system to calculate the energy lost. The predicted hourly output for an aggregator system is calculated as follows:
$$\frac{System\ Size\ *\ Derate\ Factor\ *\ Irradiance}{1000} \ *\ ( 1-Temp.\ Coefficient\ *\ ( Celsius\ Cell\ Temp.-25))$$
We can then get the energy lost as follows:
$$Energy\ Lost\ =\ \frac{Predicted\ Hourly\ Energy\ Output}{60} \ *\ Minutes\ in\ Period$$
EA Visualization
The EA for each site is available from the Analytics tab on the site details page:

The values are also available in a table on the Local Readings tab for each site:

The result includes the values used in the calculation, and can be exported in various formats:

Use the Local Readings tab to drill-down and identify why the site underperformed on a given day (circled in the previous image):

How do I calculate performance ratio?
The Performance Ratio is the ratio of the energy effectively produced (used), with respect to the energy which would be produced if the system was continuously working at its nominal STC efficiency. The PR is defined in the norm IEC EN 61724.
The energy potentially produced at STC conditions is indeed equal to GlobInc * PnomPV, where PnomPV is the STC installed power (manufacturer's nameplate value). This equivalence is explained by the fact that at STC (1000 W/m², 25°C) each kWh/m² of incident irradiation will produce 1 kWh of electricity.
Therefore for a grid-connected system:
PR = actual energy / (irradiance * DC size)
Reference: https://jira.manamonitoring.com/browse/MANA-1531
Note, similar to Predicted Power, we have here instantaneous PR (kW%) and aggregated PR (kWh%)
PR is calculated when/if irradiance > 150w/m2, or the "Minimum Irradiance Threshold" set for the site.
The values are averaged to get hourly/daily values.
It is possible to review how PR was calculated by exporting "Combined System Readings" for the system that has irradiance data (usually the site aggregator):
Once you export it you can see exactly how the PR values are calculated.
Some notes:
- PR is calculated based on momentary Irradiance and momentary Power for instances in time when irradiance > 150 W/m2, averaged out for the day.
Example
Looking at Maemae Elementary, we see that PR is calculated as 266% for 9/1/2024:

To validate this number, we can export combined readings for this system and calculate manually ourselves:

In Excel, set a column to be calculated as Solar Power * 1000 / (Irradiance * 123.12).
123.12 is the DC size of the system:

The formula in Excel:

It is then easy to calculate the average PR value for the given day:

Settings that Affect PR
Parameters that affect PR calculation are: site DC size and the site irradiance threshold.
The Site Irradiance Threshold can be set on the site form:

If PR seems incorrect, then either these parameters are incorrect, or we are getting incorrect power or irradiance readings. If power is unavailable then the system uses average power, which comes from energy readouts so those may also be a culprit.
How do I export production data?
Exporting production data is simple and provides useful information about the performance of production sites.
Simply enter into the site tab and select the site or the group of sites you wish to export production data for. If the number of sites extends beyond multiple pages, make sure to select to include “All” sites in the report.
Then, simply select the format you wish for the data to be exported in.
How do I add tags to sites?
Simply enter into the name of the site that you wish to tag and select the arrow icon next to the name of the production site.
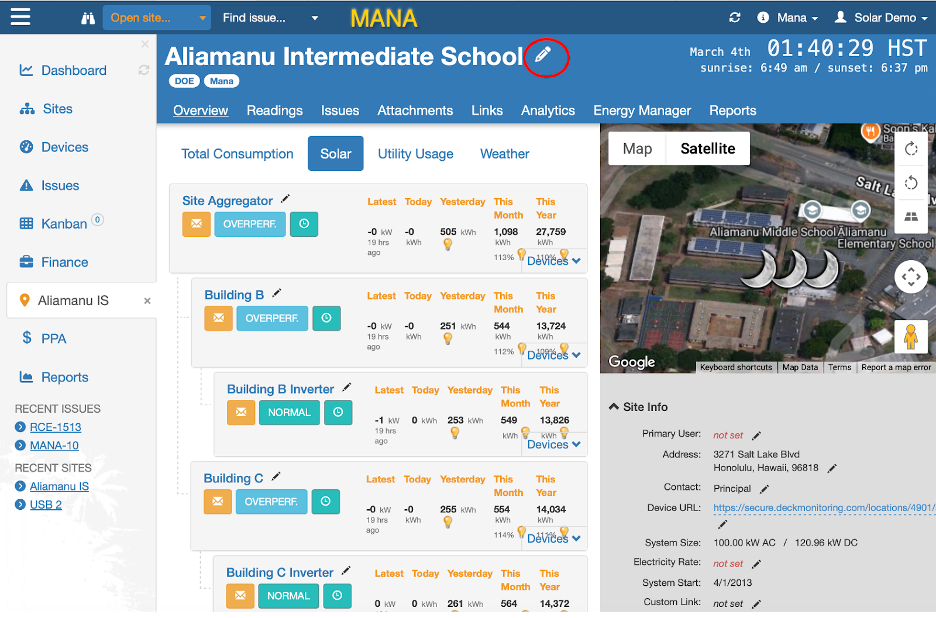
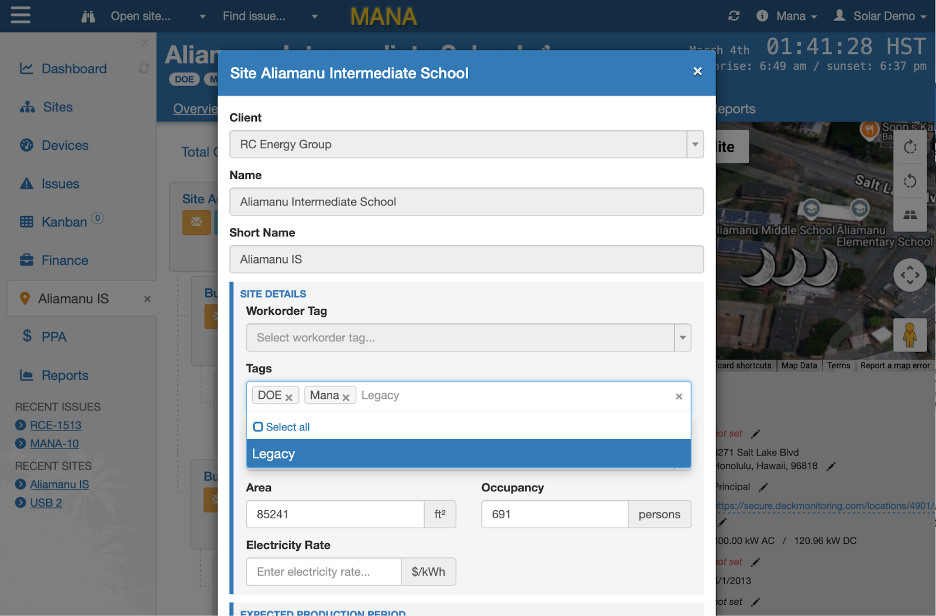
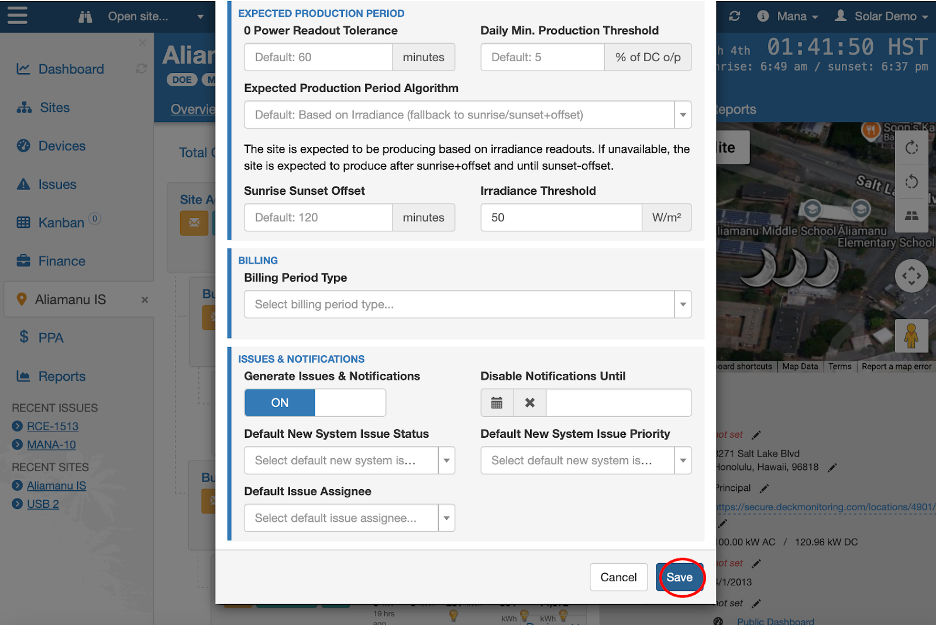
From here you can enter the name of the tag you wish to add. Make sure to save changes.
When you re-enter the site page, you can see that the tag now appears next to the name of the site and ensures that when the report is downloaded using this tag, this production site will be included.