
Overview
The Utility Report feature allows users to generate reports on their utility data.
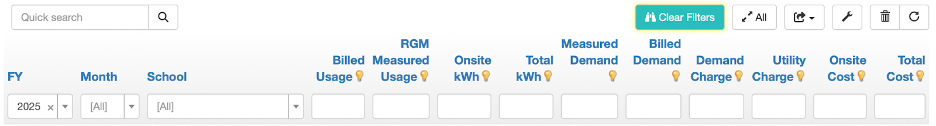
Billed usage - utility charges (kWh)
RGM Measured Usage - RGM measurements (kWh)
Onsite kWh - solar
Total kWh - billed usage + onsite
Measured demand - RGM Measured Demand (kW)
Billed demand - Utility demand (kW)
Total cost - utility charge + onsite cost
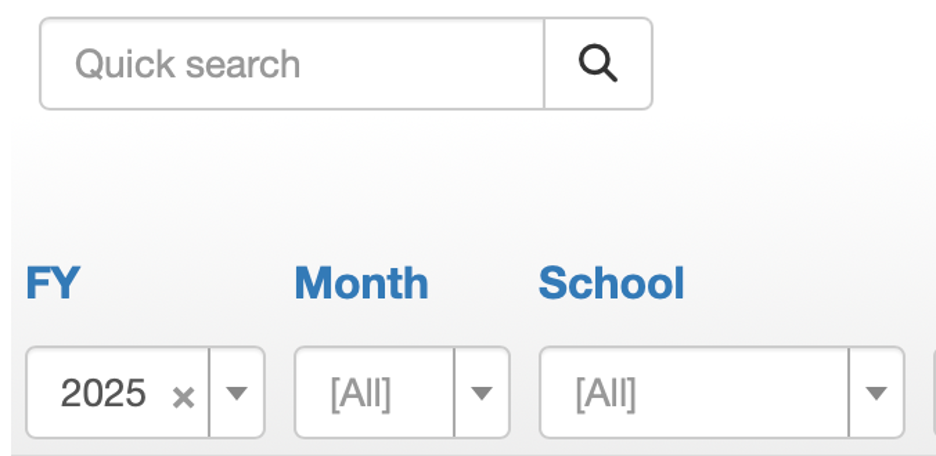
Using various filters, such as site tags, name of school, or fiscal year, users can generate reports using the export feature.
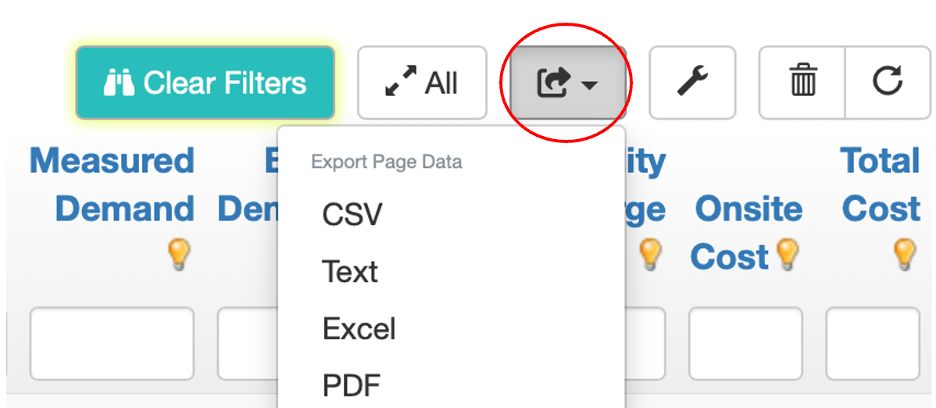
In excel formats, for example, sorting data from greatest to least according to different variables, such as demand charges, allows users to gain valuable insight into the performance of their sites and identify opportunities for lowering costs.
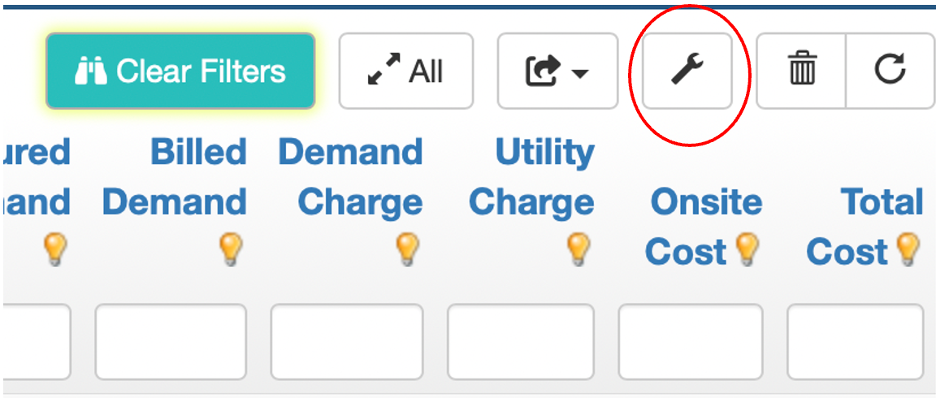
By selecting “All”, the standard page view is expanded to include all available data for a specific filter in the report.

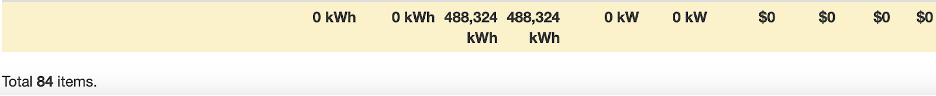
Totals can be viewed at the bottom of the page.
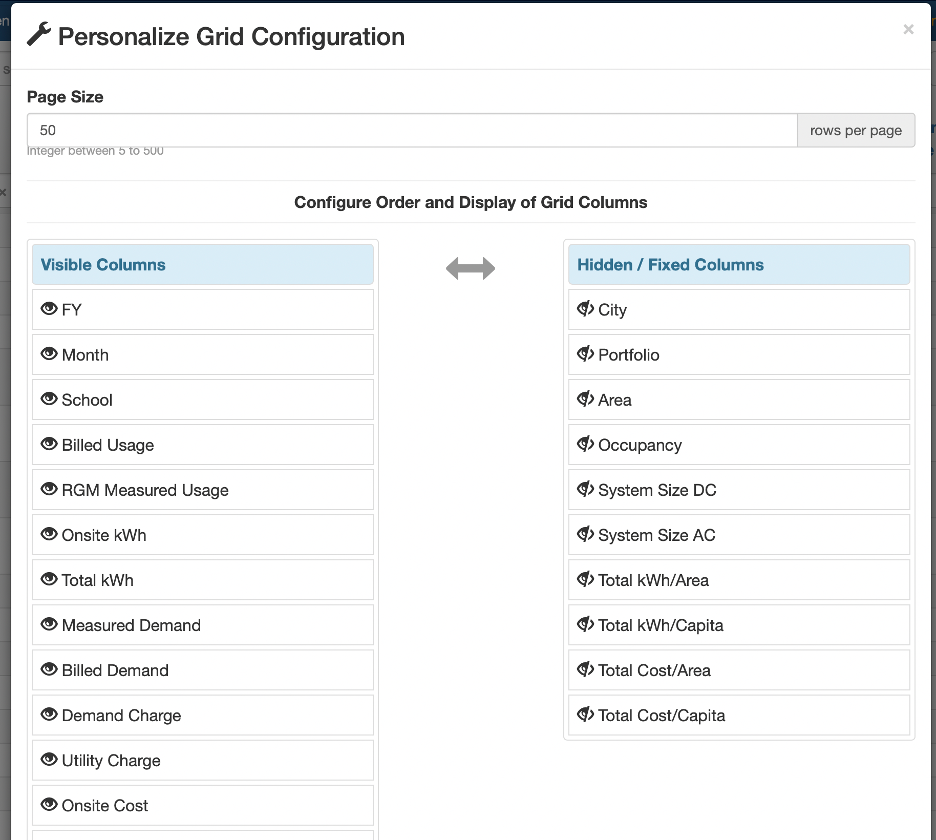
Additionally, the wrench icon allows users to personalize the columns of the site page. Simply select the icon and use drag and drop to configure the most relevant categories. Users can also change the order that they're listed on the screen to group related ones.
No Comments