|
Name
|
Type
|
Content
|
Main data sets
|
|
Advanced Site Production Report
|
|
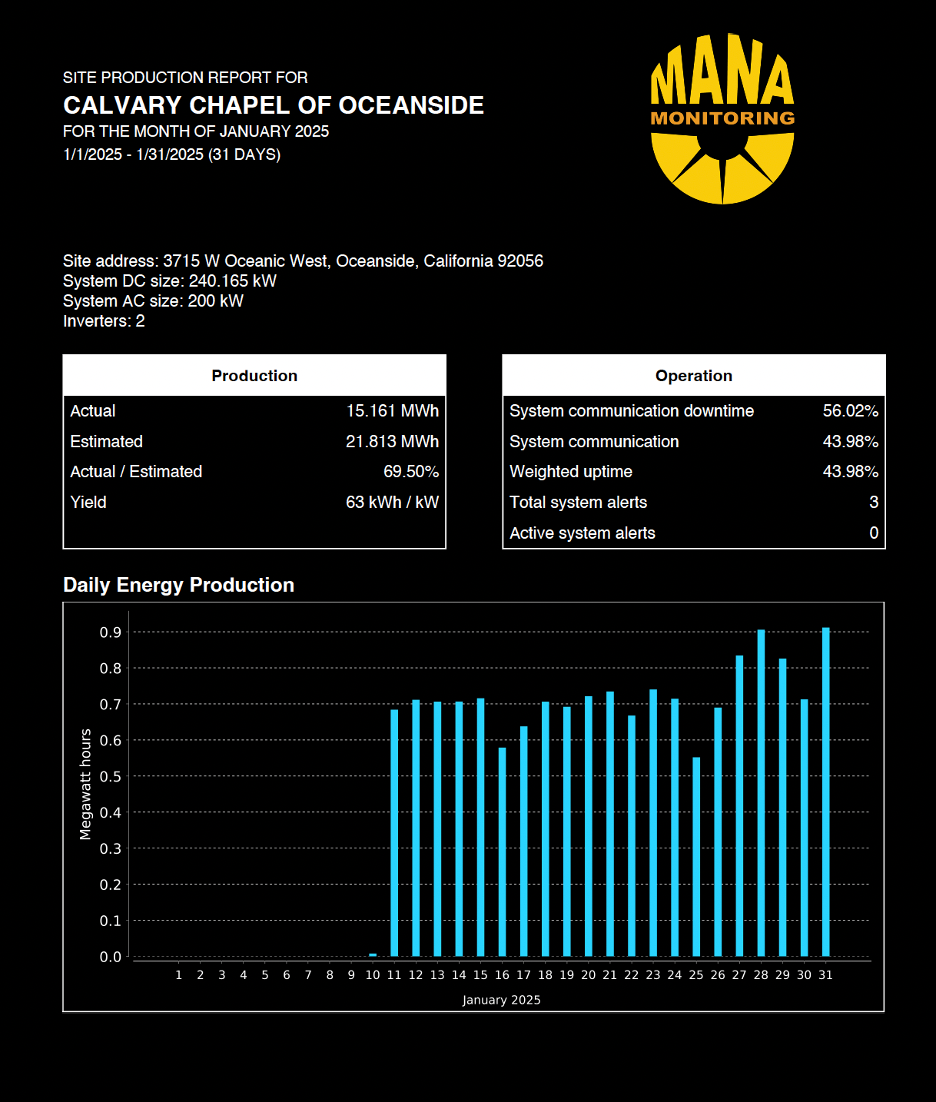
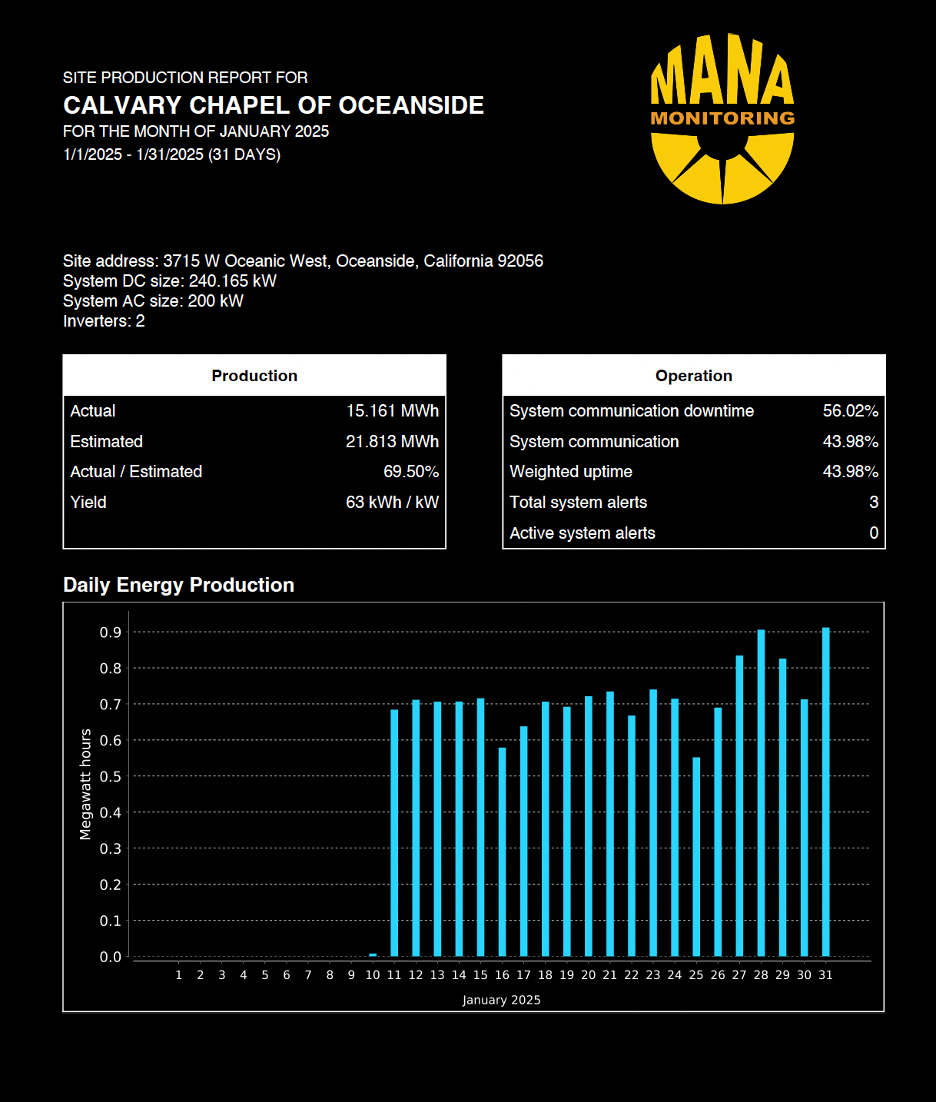
A two page report based on AlsoEnergy monthly report that contains monthly production data and operation / alert data:
- Site location information
-
AC & DC size, number of inverters
Monthly production figures (actual, estimated, actual vs. estimated, yield kWH/kW)
- Production downtime and system communication pct based on daylight / irradiance information (if available), if not between 6:30 am and 6:30 pm
- Total system alerts and open system alerts in the given month
- Daily production MWh figures in bar chart
- Daily production and estimated production MWh figures in bar chart, with data table underneath
|
|
|
Client production
|
|
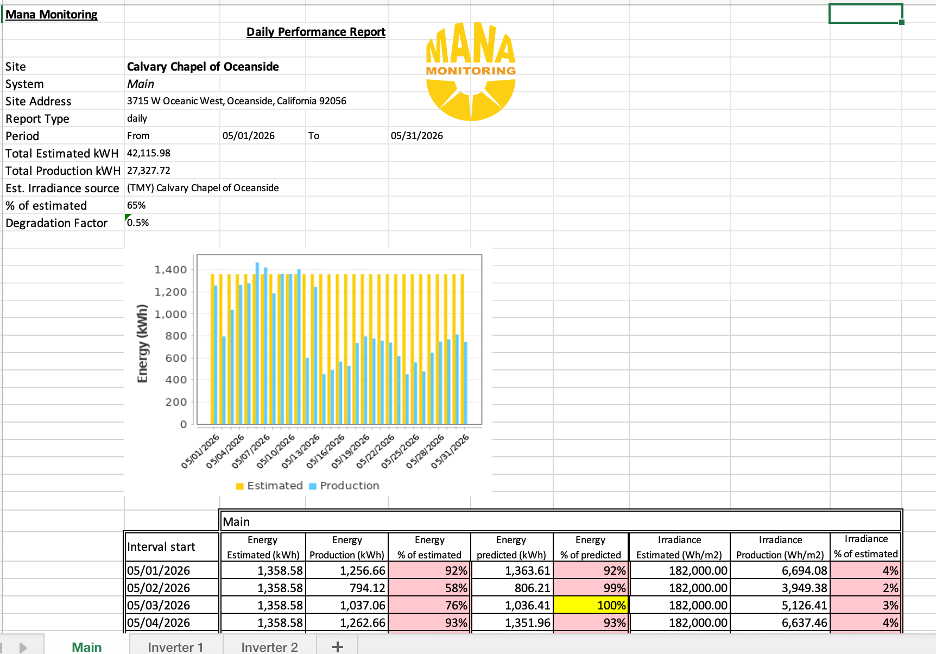
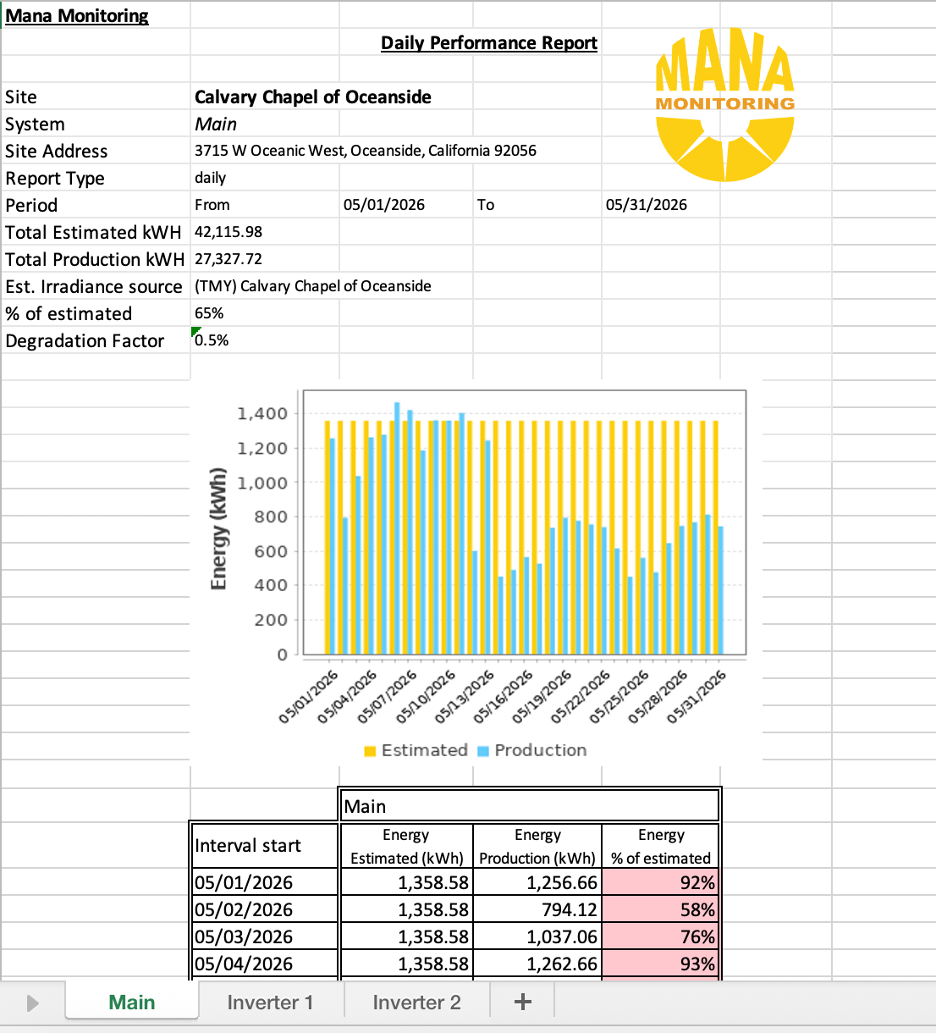
Granular report to list daily production, production estimate and predicted information both on site and subsystem / inverter level:
- Site name and subsystem name + ID
- Total energy output (kWh), estimated production (kWh)
- Irradiance (kWh/m2), irradiance estimation (kWh/m2) and prediction energy (kWh) figure (only if irradiance data is available)
|
|
|
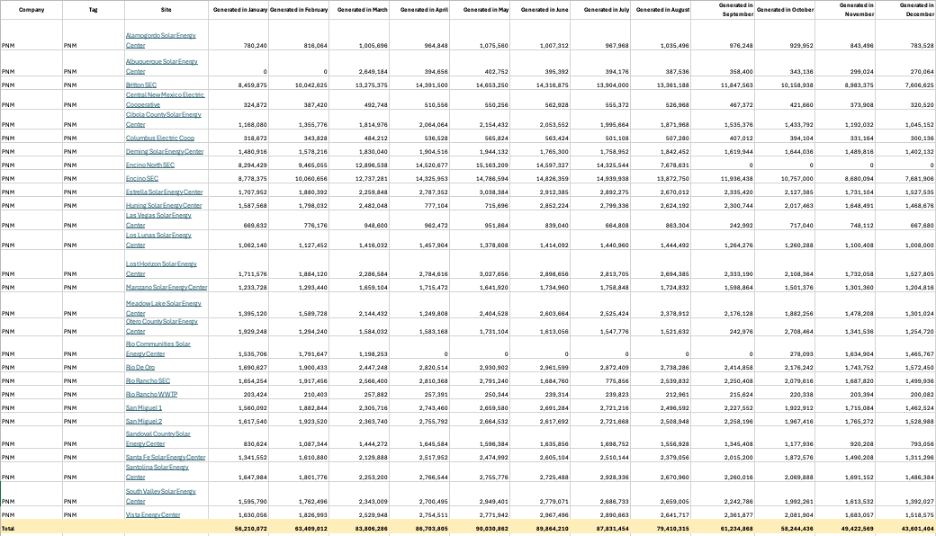
Monthly Portfolio Summary Report
|
- Granularity: Tag/portfolio
|
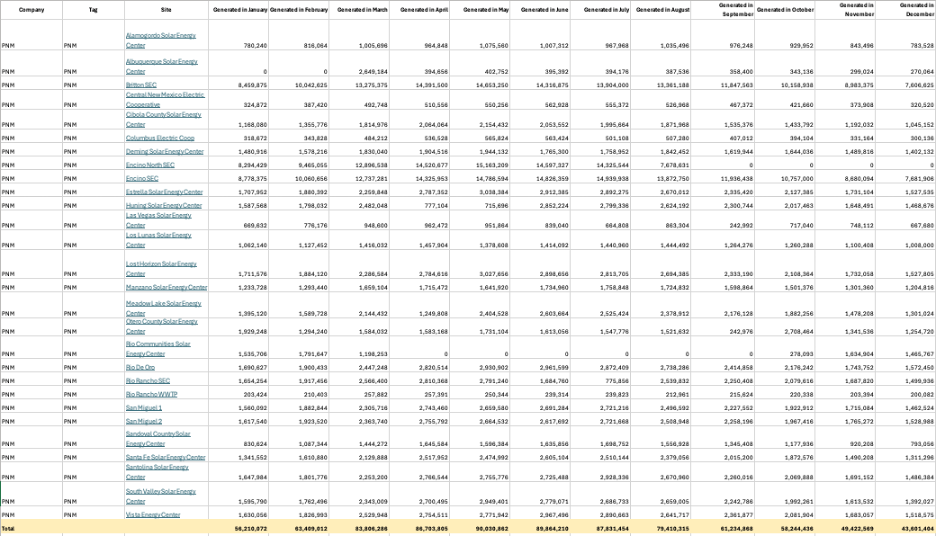
Report lists monthly production figures (kWh) for each site under a certain portfolio
|
|
|
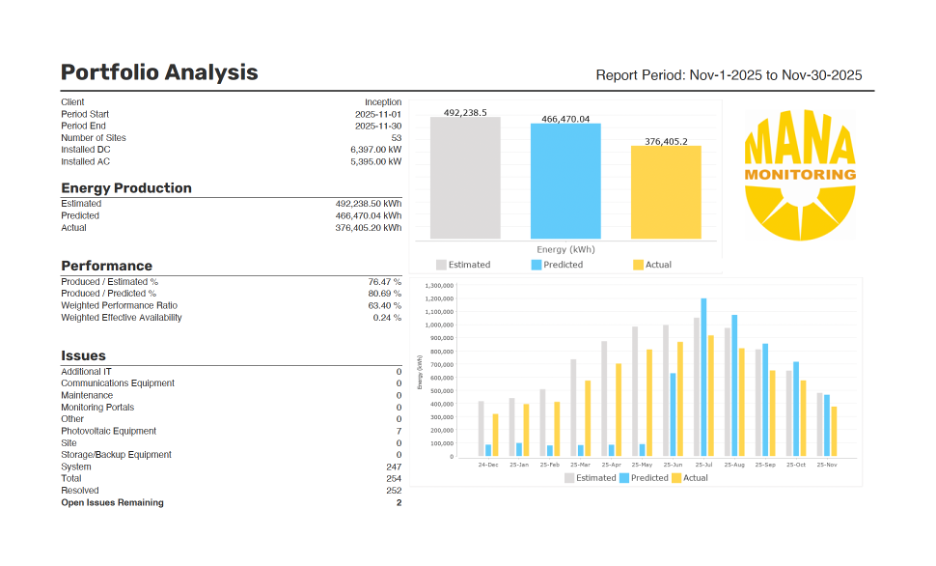
Portfolio Analysis
|
- Granularity: Tag/portfolio
|
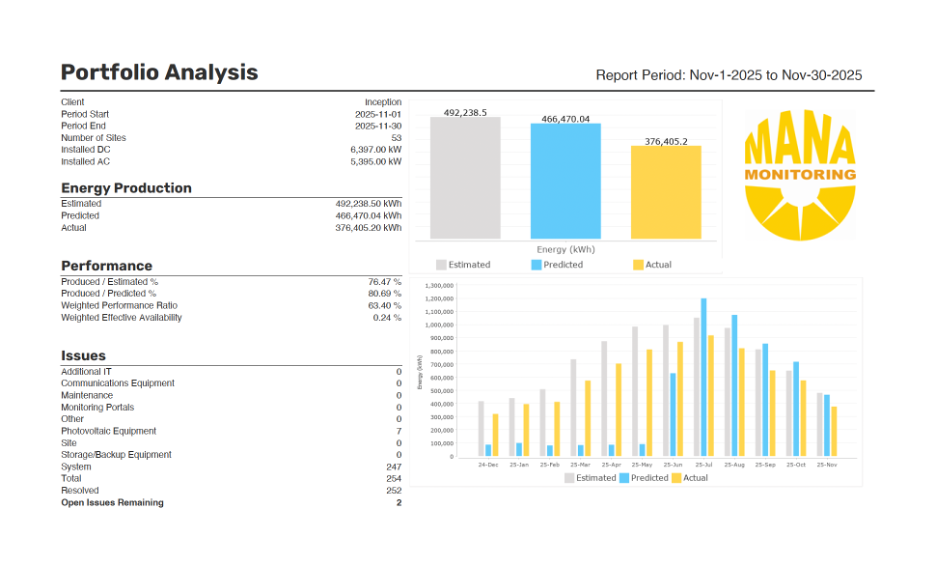
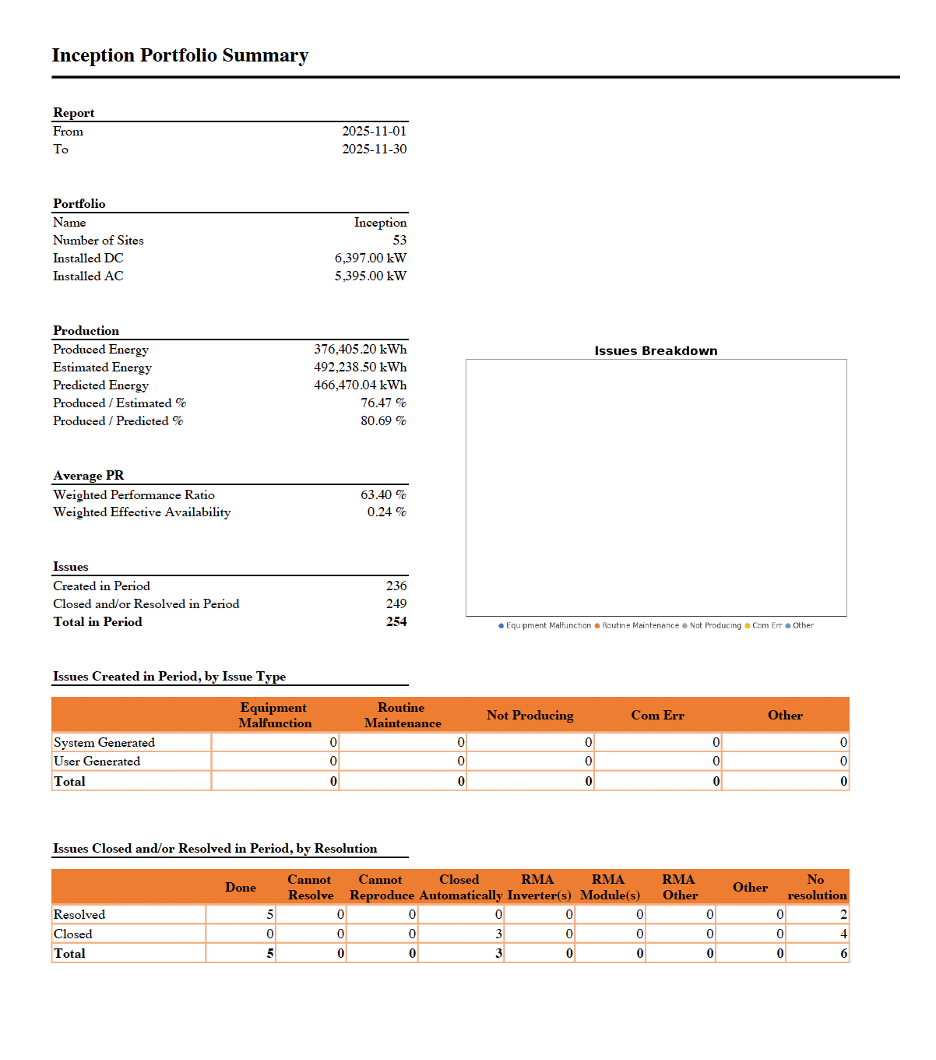
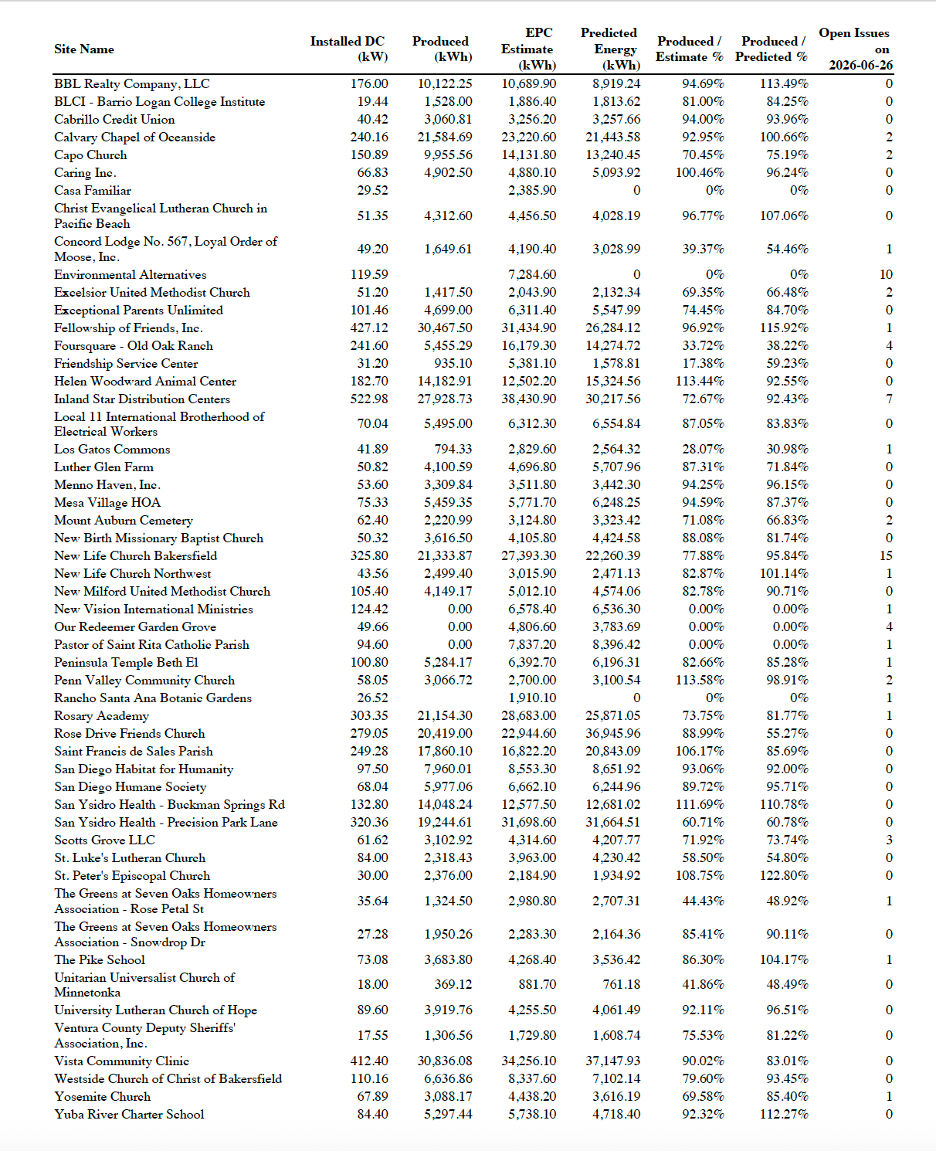
Report to review the production, performance of the a certain portfolio plus issue analytics:
-
1st page:
- Portfolio details, like number of sites in the portfolio, installed AC & DC size
- Actual, estimated and predicted production (only if irradiance data is available) in kWh, in bar chart as well; both for the whole period and for each month in the period
-
Performance metrics, like actual vs. estimated, actual vs. predicted, weighted performance ratio and effective availability based on 15-min irradiance data
Number of issues as per issue types + open issues remaining
-
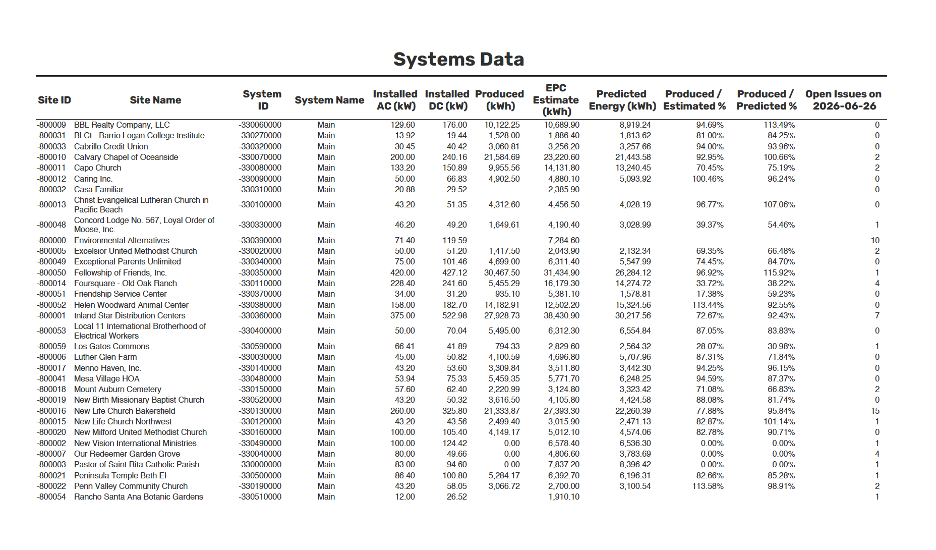
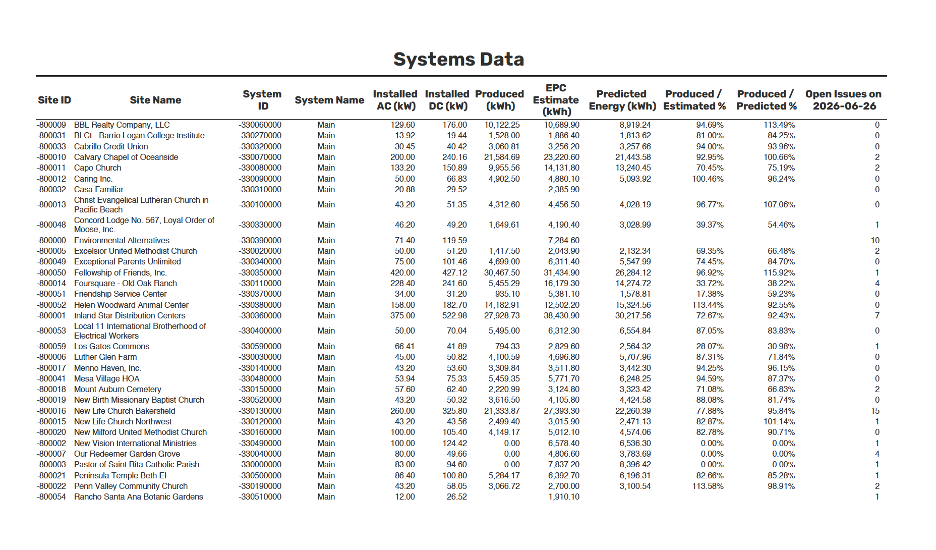
2nd page:
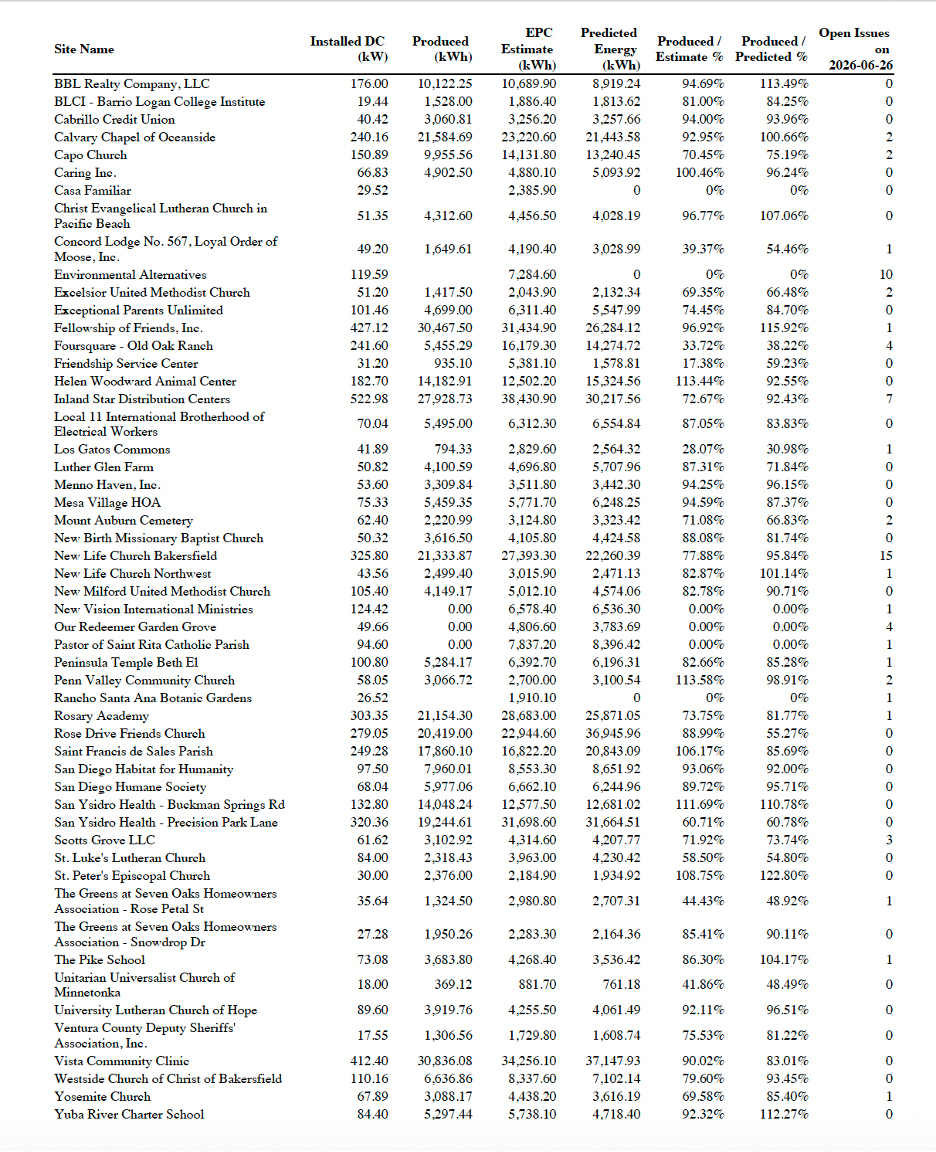
- List of sites with their name, installed AC and DC size (kW), actual production, production estimate, predicted energy (only if irradiance data is available) + key performance metrics (detailed above)
-
3rd page:
- List of issues per site, including key information, like issue type, create timestamp
|
|
|
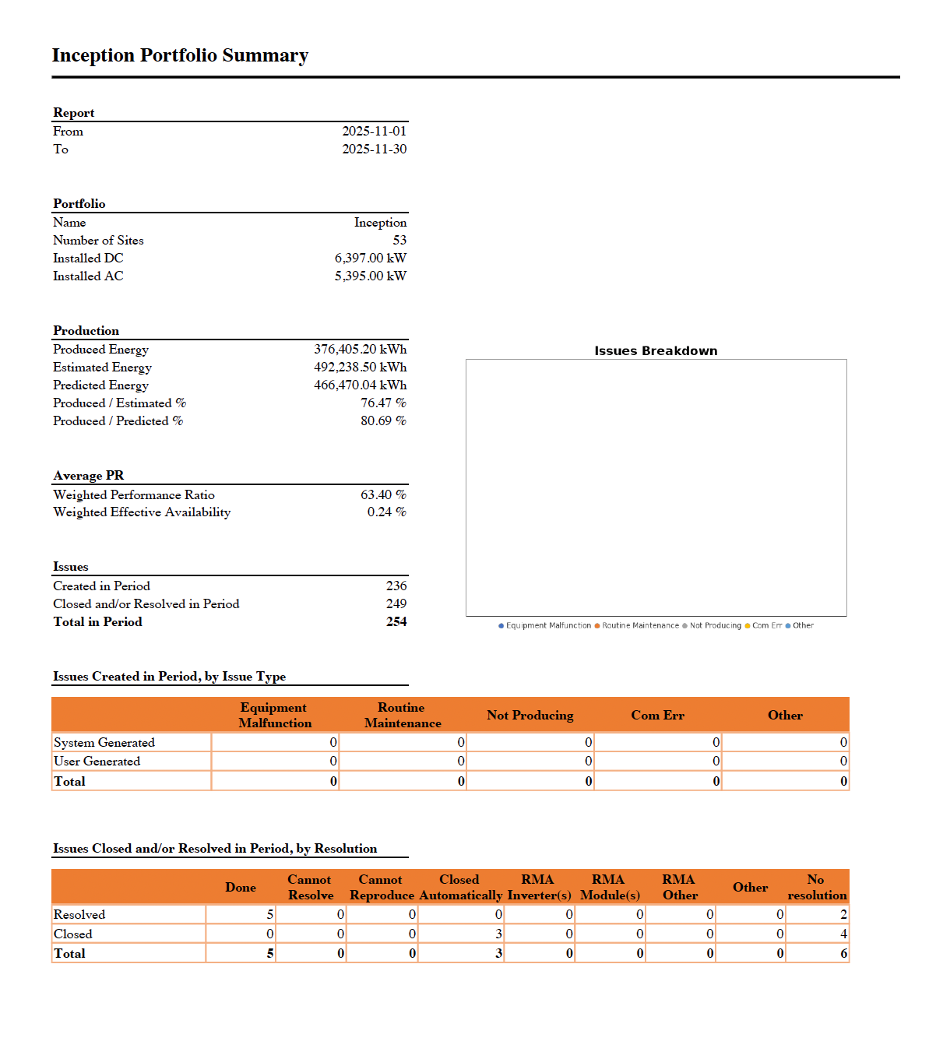
Portfolio Issues & Readouts Analysis
|
- Granularity: Tag/portfolio
|
Report with almost the same content as "Portfolio Analysis" extended with issue analytics:
- Additional data set compared to "Portfolio Analysis" report
- Distribution of issues by issue type and system vs. user generated ones
- Distribution of closed / resolved issues by resolution
|
|
|
Portfolio Overview
|
- Granularity: tag/portfolio
|
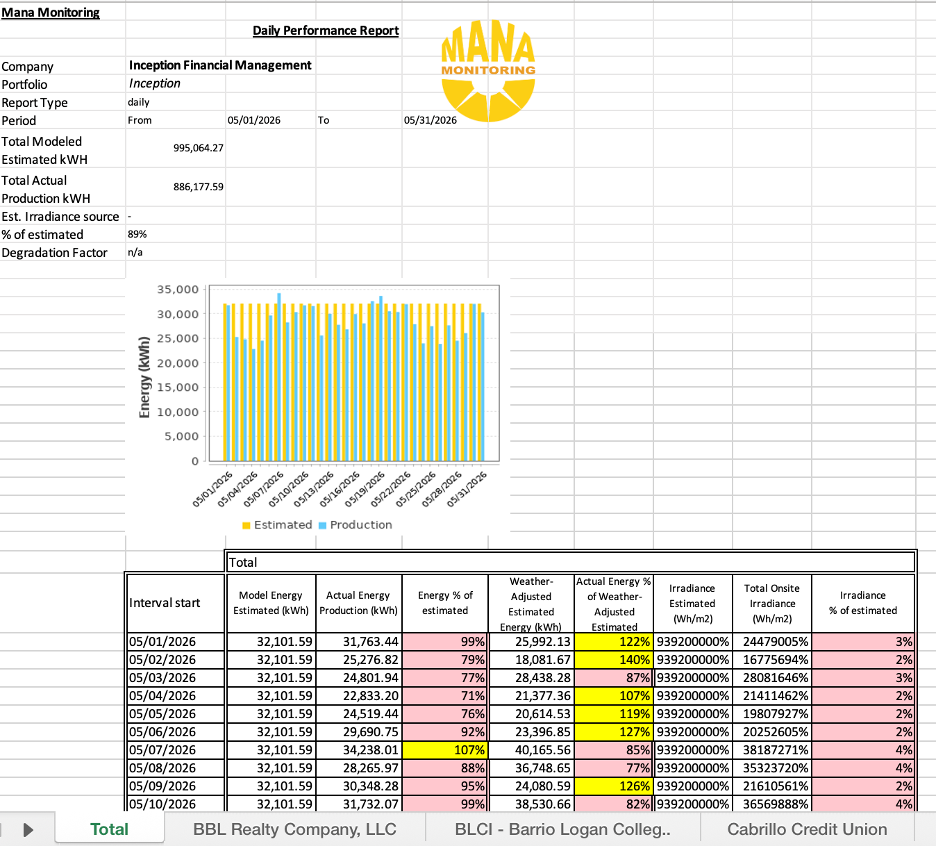
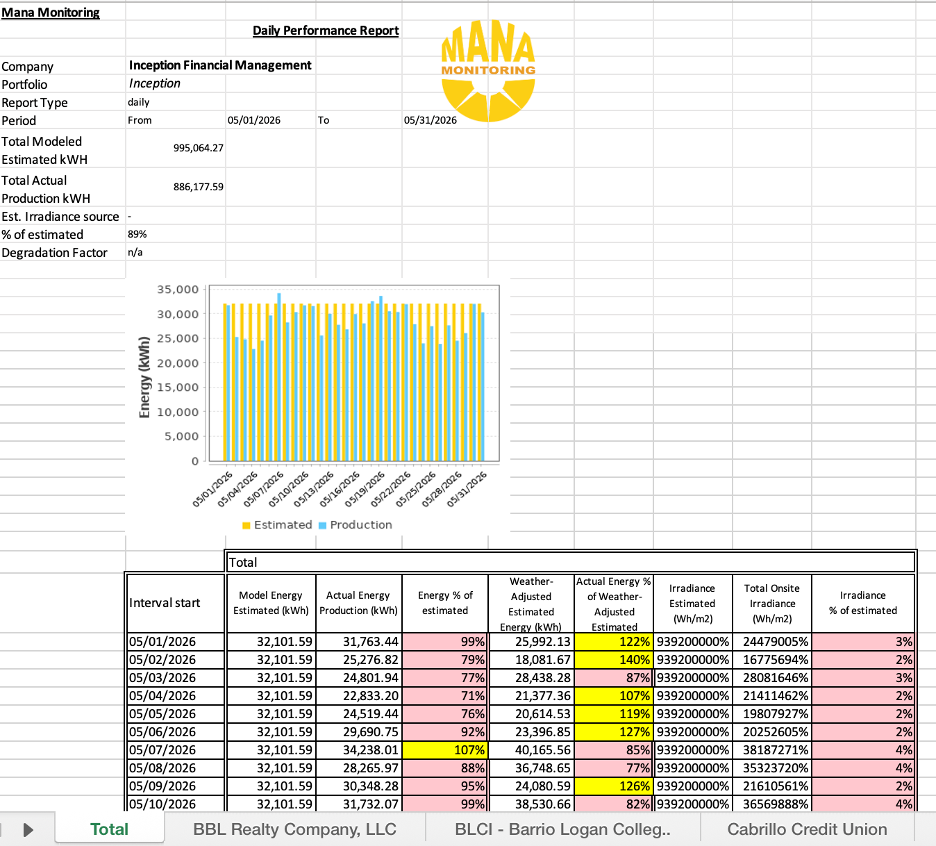
Report with key metrics about the respective portfolio + individual sites on separate sheets:
-
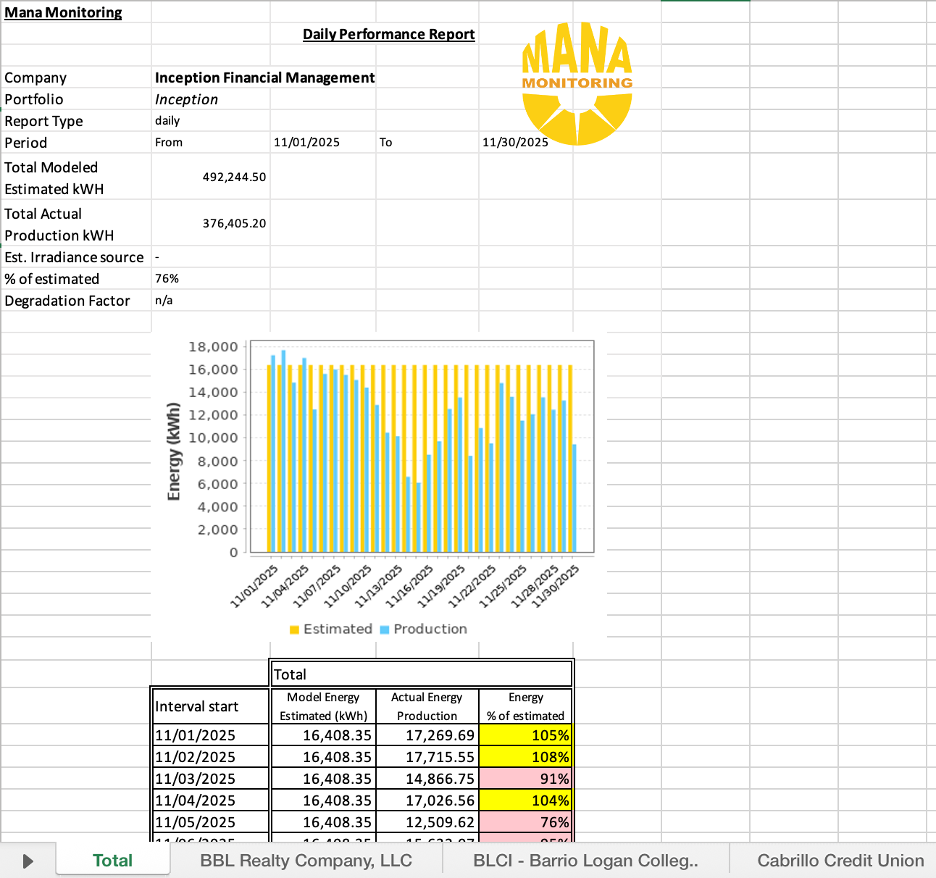
Summary / total sheet (for the whole portfolio)
Total actual production + estimation (kWh), actual production vs. estimation
Monthly distribution of actual production, production estimate, actual production vs. Estimation
- Monthly distribution of the same metrics for irradiance (only if irradiance data is available)
- Site specific sheet
- As many sheets as the number of sites within the portfolio with the very same data set as available in the summary / total sheet
|
|
|
Portfolio Overview Basic
|
- Granularity: Tag/portfolio
|
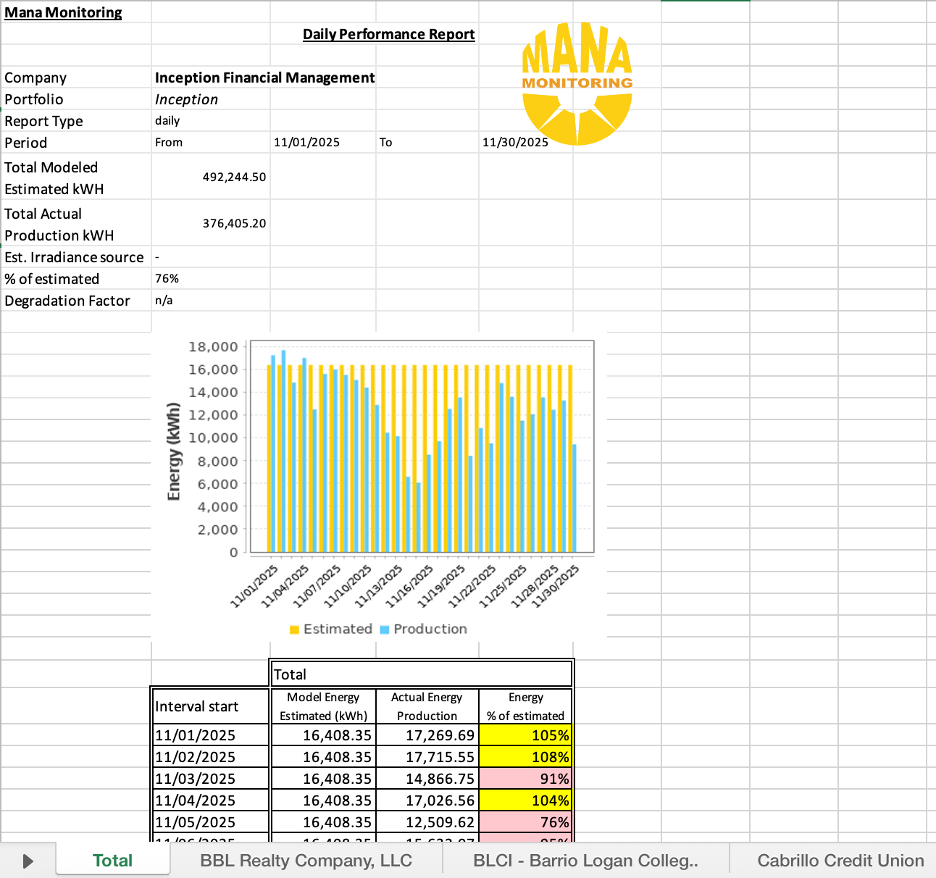
The very same report as "Portfolio Overview" but without irradiance data
|
|
|
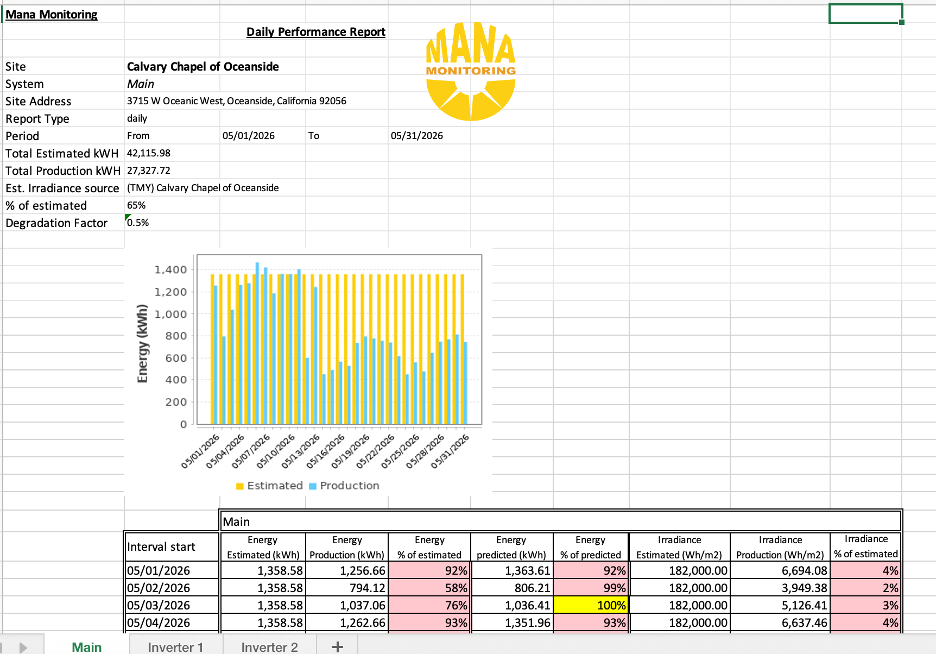
Production Overview
|
- Granularity: Site / subsystem
|
The very same report as "Portfolio Overview" that can be generated either for a site or just for a particular subsystem / inverter at the site (depending on last reporting criteria)
|
|
|
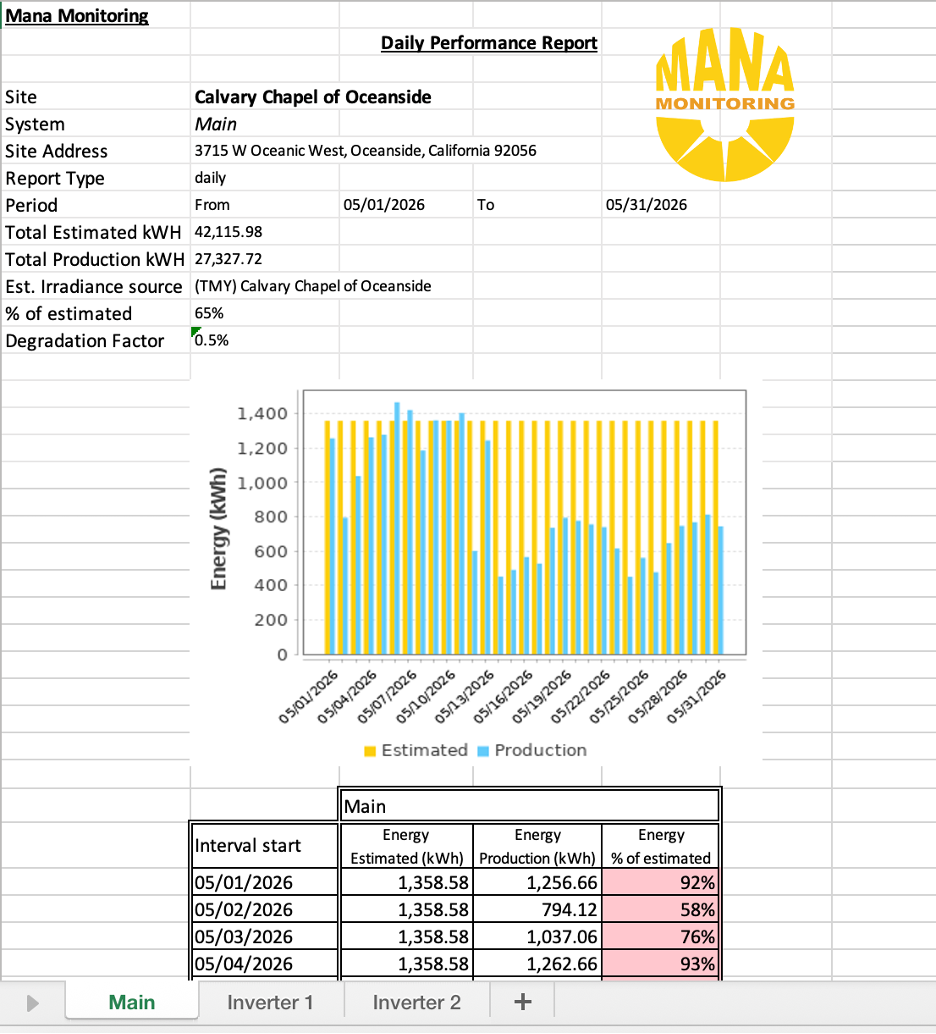
Production Overview Basic
|
- Granularity: Site/subsystem
|
The very same report as "Portfolio Overview Basic" that can be generated either for a site or just for a particular subsystem / inverter at the site (depending on last reporting criteria)
|
|
|
PV report
|
-
Period: Calendar / PTO / Commencement year
|
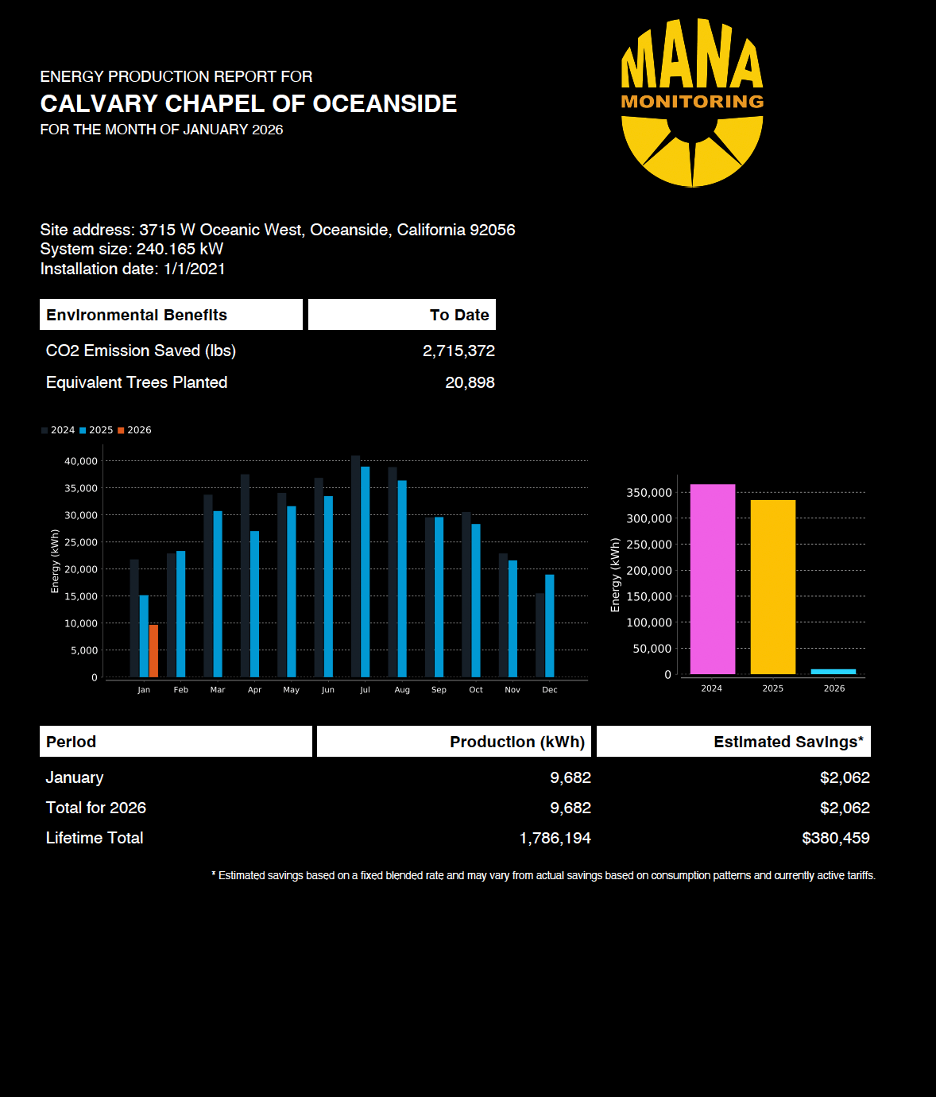
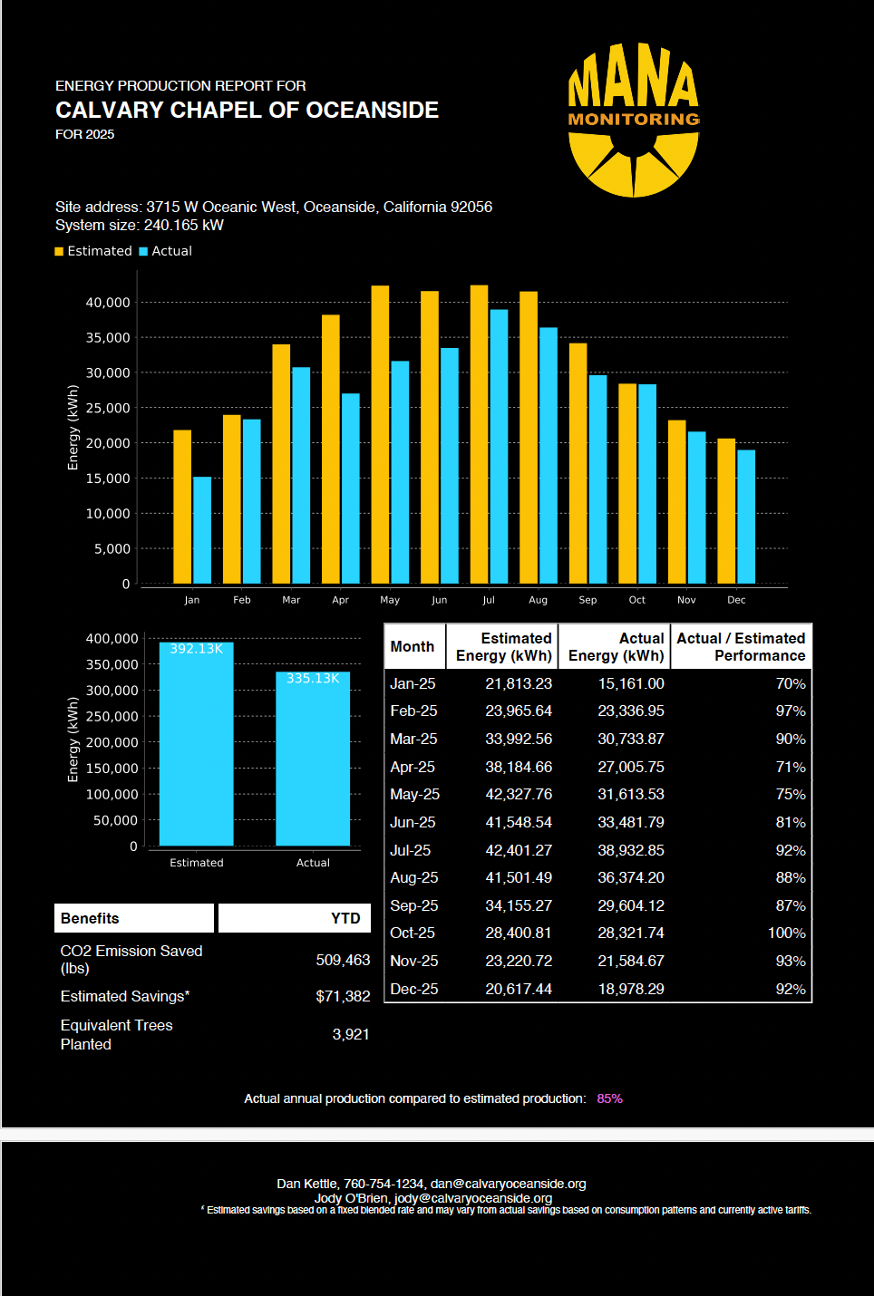
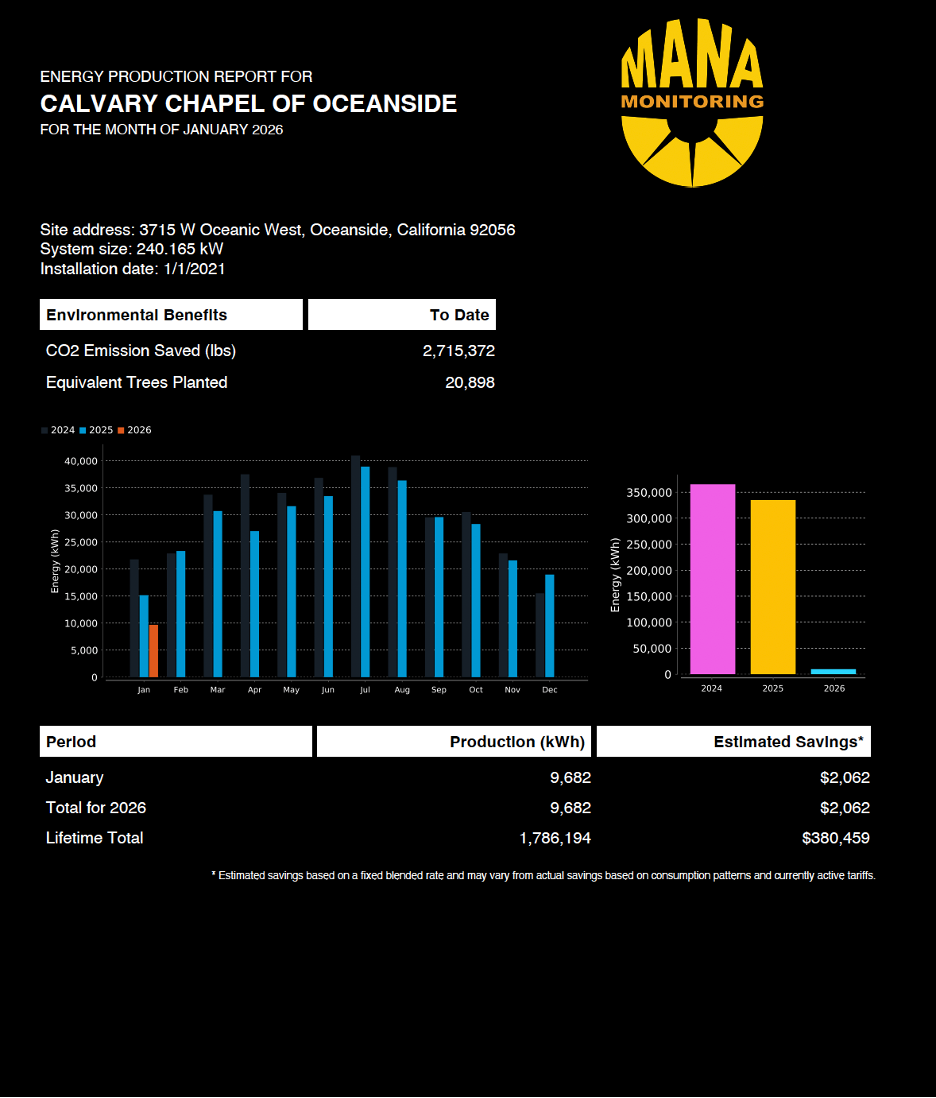
Summary report for a particular site production in a specific year with 3 years comparison + environmental benefits + estimated savings:
- Site location information
- AC size + installation date
- Environmental benefits, including CO2 emission saved (lbs), equivalent trees planted
- Monthly and yearly production (kWh) charts for the last 3 years
- Monthly actual production (kWh) and estimated savings ($) for reporting year
|
|
|
Site Net Energy Report
|
|
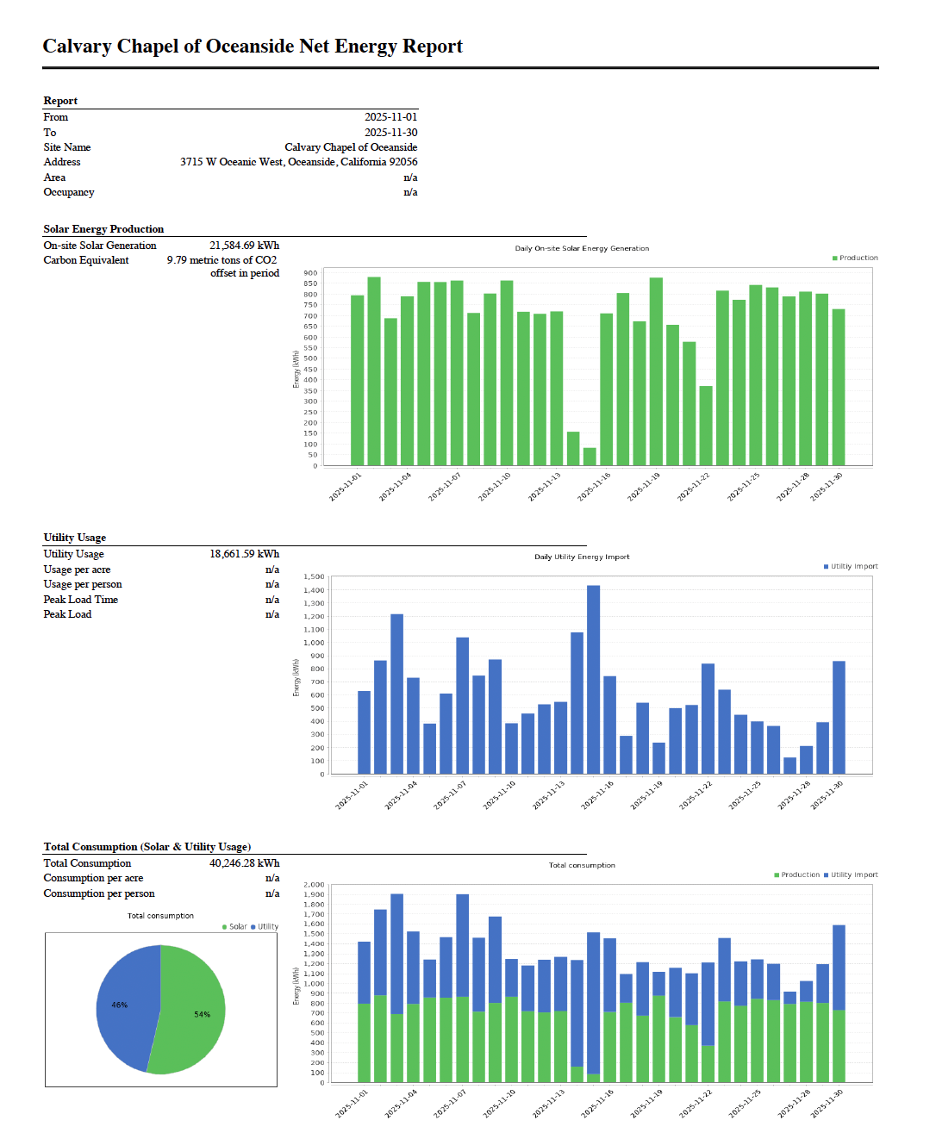
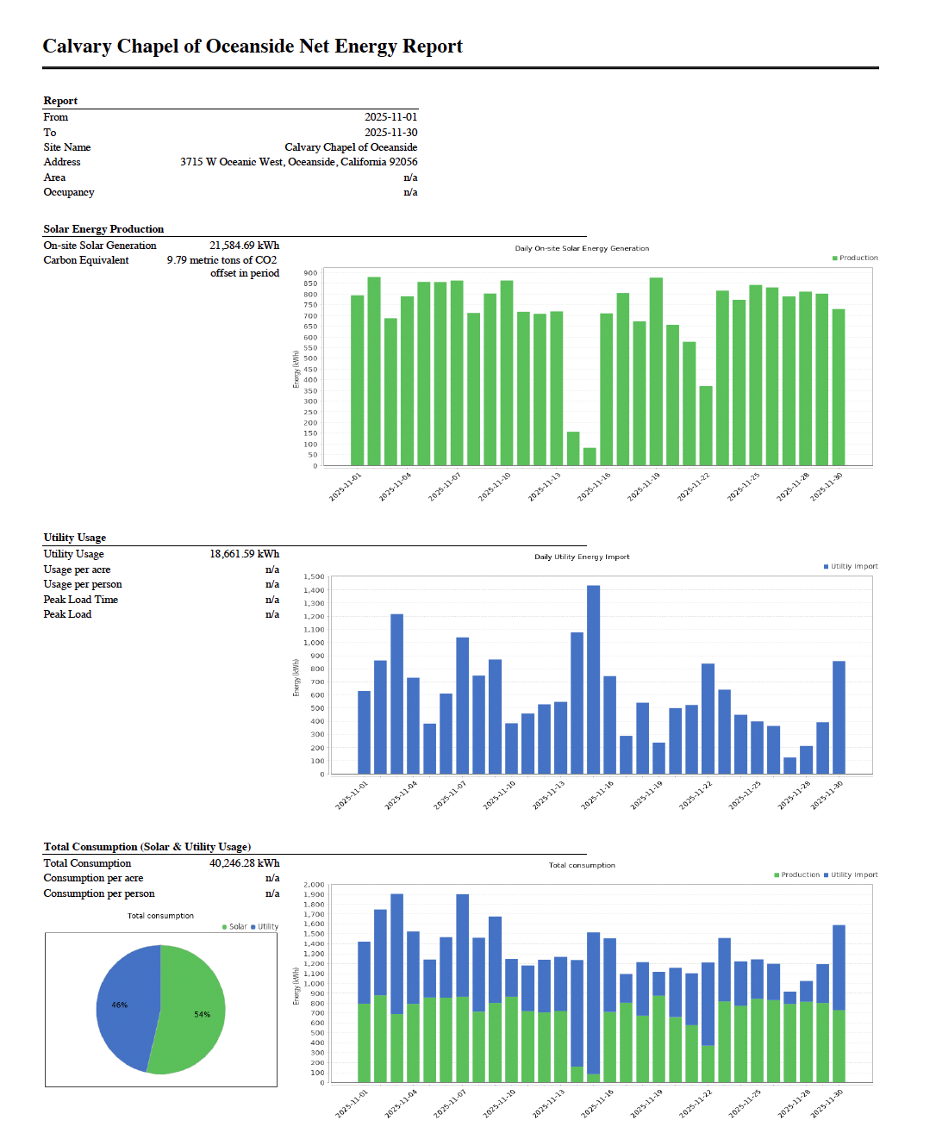
Report includes a breakdown of :
- Solar energy production — including on-site solar generation and carbon equivalent
- Utility usage
- Total consumption (solar & utility usage)
|
 |
|
True Up Report
|
- Period: Calendar / PTO / Commencement year
|
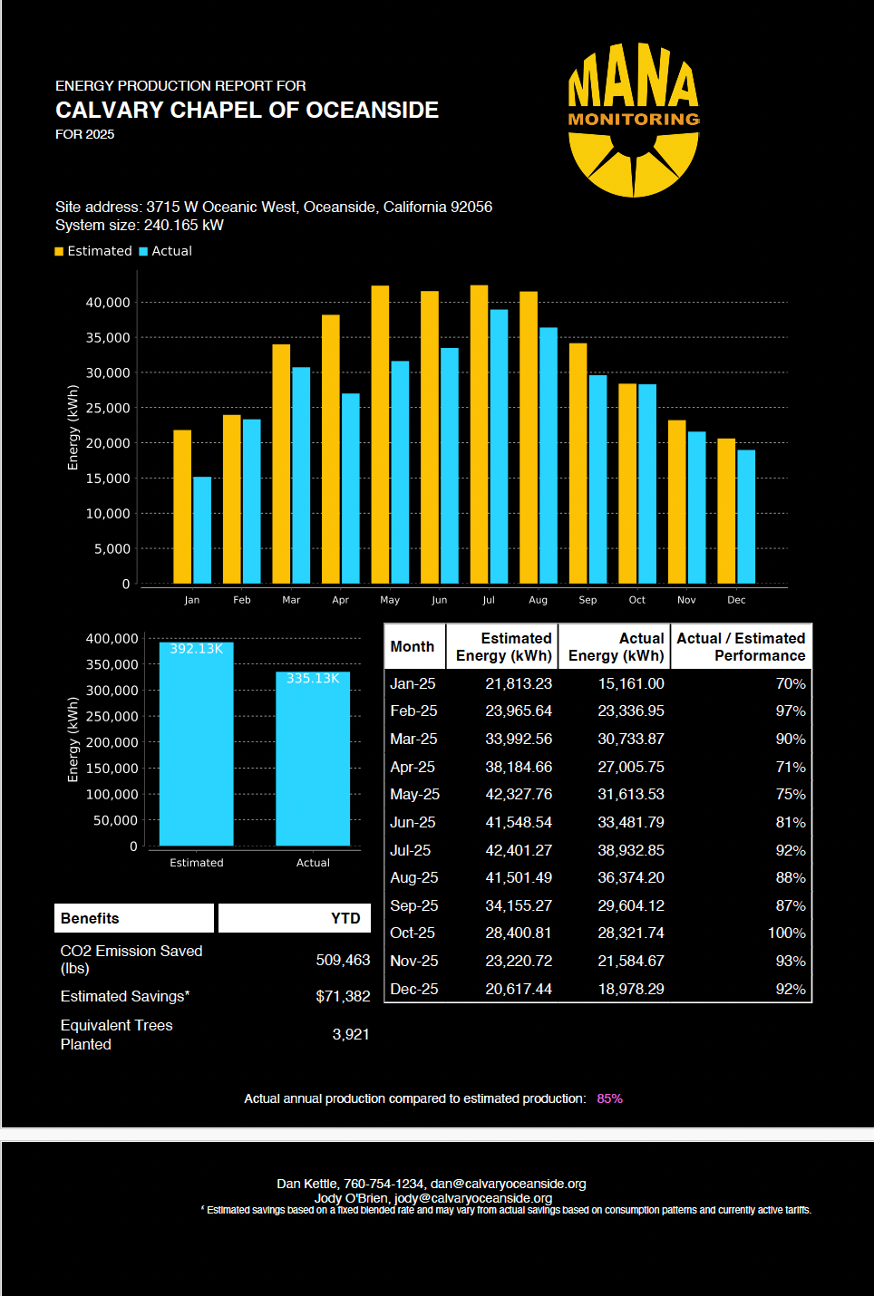
True-up report with key information for a specific year:
- Site location information
- AC size
- PTO date
- Monthly actual production and production estimate (kWh) in given year, in a bar chart
- Yearly estimated, actual and guaranteed production (kWh). Guaranteed only if there's any production guarantee
-
Environmental benefits, like CO2 emission saved (lbs), estimated savings ($) and equivalent trees planted
+ service log information (if registered in Mana)
|
|
|
Tenant Utility
|
Format: .xlsx
Granularity: Portfolio
Period: Month
|
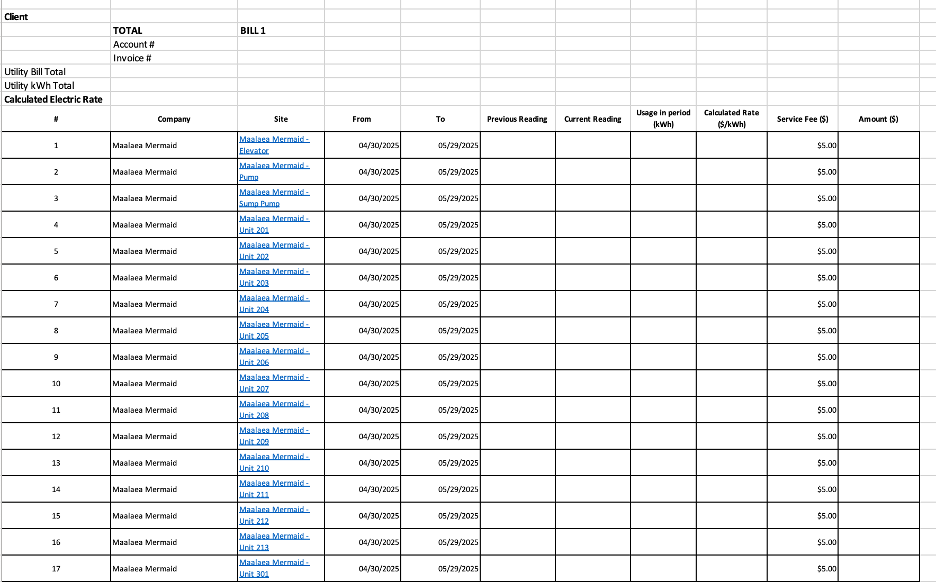
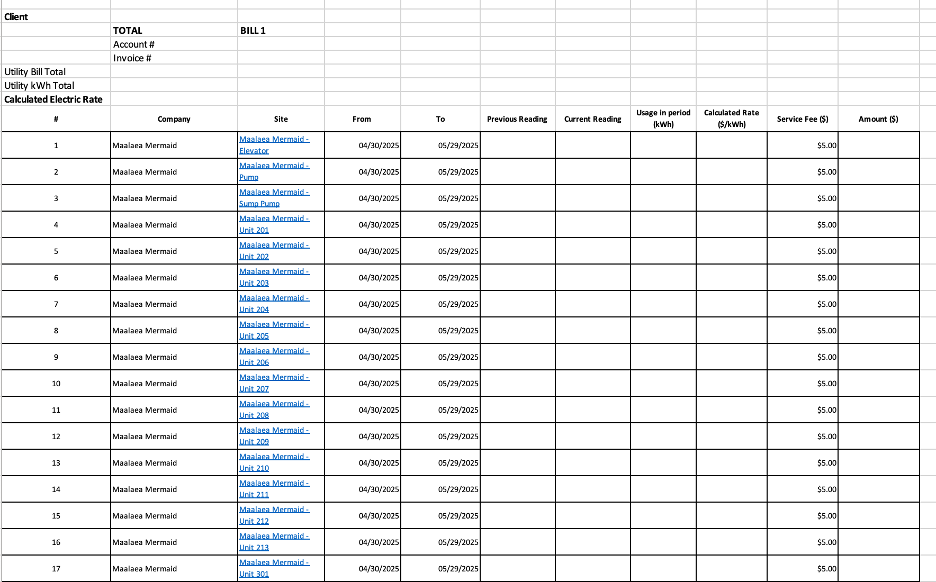
Breakdown of energy
usage during billing period across units. Includes calculated rate and total amount due.
|
|

No Comments